Download
1 / 31
310 likes | 509 Views
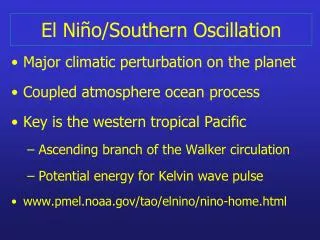
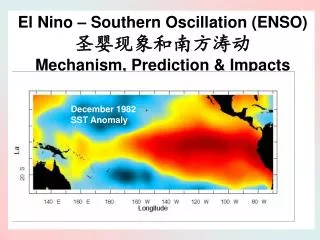
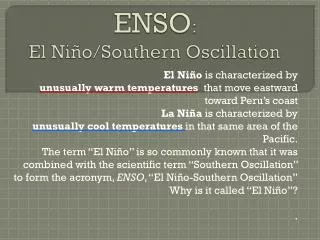
ENSO : El Niño/Southern Oscillation . El Niño is characterized by unusually warm temperatures that move eastward toward Peru’s coast La Niña is characterized by unusually cool temperatures in that same area of the Pacific.

E N D
ENSO: El Niño/Southern Oscillation El Niño is characterized by unusually warm temperatures that move eastward toward Peru’s coast La Niña is characterized by unusually cool temperatures in that same area of the Pacific. The term “El Niño” is so commonly known that it was combined with the scientific term “Southern Oscillation” to form the acronym, ENSO, “El Niño-Southern Oscillation” Why is it called “El Niño”? .
Oscillation? Oscillation is the action of something that shifts back-and-forth An oscillating fan cooled the room as it moved to the right and then to the left. The Southern Oscillation is an alternating pattern of warmer- or cooler-than-normal ocean surface temperatures. Each cycle of the pattern can take years.
ENSO • Anomalies are deviations from normal, or “nominal”, temperatures • Unusually warm temperatures are shown in red,unusually cold anomalies in blue. Here are the actual temperatures in the top slide, then the anomalous temperatures in the bottom slide. • http://www.cpc.ncep.noaa.gov/products/analysis_monitoring/enso_update/sstanim.shtml
ENSO in action: a typical El Niño weather pattern Dec-Feb, any year
ENSO in action: a typical El Niño weather pattern Jun-Aug, any year
ENSO in action: a typical La Niña weather pattern Dec-Feb, any year
ENSO in action: a typical La Niña weather pattern Jun-Aug, any year
ENSO • Each cycle can be strong or weak. • The unusually warmer or cooler temperatures can be a few or even several degrees warmer or cooler from what historically has been recorded. • Strong ENSO seasons can result in severe weather disruptions in many areas far away from its location in the equatorial (tropical) Pacific • On the next slide, record 3 North & South American events caused by an El Niño event.
Remember! ENSO is not the normal situation. ENSO cycles are deviations from data recorded over many years ENSO seems to follow a pattern of every 2-7 years…but lately has been 3-4 years. ENSO can last 12-18 months, or LONGER! Unpredictability is a hallmark of this phenomenon
Tropical Cyclones! Carla-1961 Ike- 2008 Katrina-2005 Rita- 2005 Tropical Storm Allison-2001 Alicia-1983 Galveston 1915 And …the Great Storm of 1900! All are tropical cyclones that have affected our region.
What is a tropical cyclone? • It is an area of disturbed weather (storms) that has a closed circulation in tropical regions and it is not connected to a low pressure frontal boundary. • Closed Circulation means the winds blow around it in a circular, or cyclonic, pattern • It has its origins in the tropics • It has low pressure in its center, meaning air is rising • It is isolated, i.e., not part of a cold front • It has sustained winds in excess of 64 kn, 74 mph, 119 km.hr
Heat from the tropics… • Warms the air in the tropics • This warm, humid air rises • Convergence of wind currents in the ITCZ are believed to start the rising air to spin, causing a cyclonic action • (See where the winds converge, then diverge…this starts the rising air to spin.)
Hot stuff! • Heat is carried “aloft”, meaning high into the atmosphere • Also, the “core” of a tropical cyclone is warmer than the air surrounding it. That is what makes it “tropical” • Tornadoes, for example, are not tropical in this sense- their core of cyclonic air is not warmer than the surrounding air.
More hot stuff… • Tropical cyclones are one method to spread excess heat from the tropics to higher latitudes • The enormous amount of water in a tropical cyclone carries heat with it as the storm moves away from the Inter-Tropical Convergence Zone (ITCZ)
Intertropical Convergence Zone The ITCZ is an area of low pressure located roughly 5 degrees North and South of the Equator. It is a place where air converges, rises, and condenses (forming clouds). It is the rainiest place on Earth!
ITCZ- notice how the TC’s stated just north and south of the equator; that is the Inter-Tropical Convergence Zone
Here is a closer look at where TS’s form This should generate numerous questions/comments based on observations.
Remote sensing devices • …are used to gather data far out at sea. • They track current velocities, winds, temperature, air pressure and other development factors as TC’s progress • Such devices as • Ships, • Weather Balloons, • Satellites, • Aircraft • And buoys all play an important role in tracking storms.
More remote sensing devices Technology & TC’s. Ocean buoys, for exam-ple, upload data to satellites at regular intervals . The data is then interpreted by meteorologists and computer programs that detect anomolous weather patterns and make predictions.
Data gathering assists in the prediction of landfall, intensity, potential damage and loss of life from TC’s.
Positive & Negative Feedback • Positive Feedback is when an event increases due to an outside factor • Negative feedback is when an event decreases due to an outside factor. • Examples: • Pos Feedback- tropical heating is increased by the water vapor changing phase to liquid droplets- heat of condensation. This causes warm humid air to become even warmer! • Negative feedback is when white icecaps reflect heat back to space, reducing the heat absorbed within the Earth’s atmosphere.
TC’s are caused by excess heating of the tropical waters • Heat is increased by the water within the TC when water vapor phase changes to water droplets in the clouds (heat of condensation) • This is positive feedback, increasing the heating within the system • However, the TC’s has such a large cloud cover that shades the water under it, reducing the potential for further solar heating • It also churns up the ocean waters, bringing cooler water to the surface. • These affect the TC by reducing the heat coming into the system- an example of negative feedback.
By the way… • Tropical cyclones have several monikers • Typhoon and Hurricane are the same things, they just have different names in different regions of the world. • In the Northern Hemisphere they spin CCW • In the Southern Hemisphere they spin CW
Mechanics & Anatomy Heat of Condensation-increases the potential and actual heat within the storm Strong Vertical (Rising) Air Currents- create low pressure Strong Lateral Air Currents- swirl around the “eye”; these interact with the vertical currents to spawn waterspouts and tornadoes Heavy Rainfall is caused by the humid tropical air rising, condensing, and precipitating water
Storm Surge & Storm Tide • The Storm Surge is an area of higher-than-normal sea level that moves with the TC • It is caused by the Eckman Spiral & Lower Air Pressure • The Eckman spiral pushes all the water to the center of the circulation (in both hemispheres) • Storm Surges can be 1m - >5 m higher than sea level causing tremendous damage • Each m3 of water weighs 1 MT x velocity = FORCE! • It is the measured as total water height above “mean high tide”
Storm Surge & Storm Tide The Storm Tide is slightly different: it is the total height above NGVD, the “National Geodetic Vertical Datum”, or official sea level http://en.wikipedia.org/wiki/Image:Sloshrun.gif Storm Surge/Tide is compounded by the increased rainfall from land, the height of waves driven by winds, and the increased sea level if a high tide occurs as TC makes landfall
Storm Surge & Storm Tide 10mm rise in sea level for each millibar drop in air pressure That is 4” is sea level rise with each mm less of air pressure!
Notice Rita’s trackStorm Tides was measured for Rita, 2005: the area with the sensors is outlined Two devices were used- One is for barometric pressure The other for water pressure http://pubs.usgs.gov/ds/2006/220/
Sensor locations- 47 sensors were quickly deployed in the hours prior to Rita to record water and barometric pressure Notice the extent of salt water flooding over much of SE Louisiana- measurements are in feet
Costliest U.S. Atlantic Hurricanes Total estimated property damage, 2005 USD • 1 MIAMI 1926 $157 billion • 2 GALVESTON 1900 $99.4 billion • 3 KATRINA 2005 $81.0 billion • 4 GALVESTON 1915 $68.0 billion • 5 ANDREW 1992 $55.8 billion • 6 NEW ENGLAND1938 $39.2 billion • 7 CUBA-FLORIDA 1944 $38.7 billion • 8 OKEECHOBEE 1928 $33.6 billion • 9 DONNA 1960 $26.8 billion • 10 CAMILLE 1969 $21.2 billion