Download
1 / 7
70 likes | 263 Views
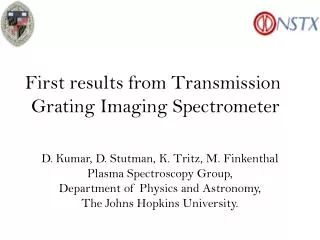
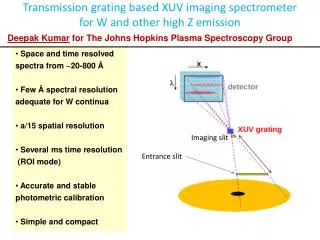
Transmission grating based XUV imaging spectrometer for W and other high Z emission. Deepak Kumar for The Johns Hopkins Plasma Spectroscopy Group. Space and time resolved spectra from ~20-800 Å Few Å spectral resolution adequate for W continua a/15 spatial resolution

E N D
Transmission grating based XUV imaging spectrometer for W and other high Z emission Deepak Kumar for The Johns Hopkins Plasma Spectroscopy Group • Space and time resolved spectra from ~20-800 Å • Few Å spectral resolution adequate for W continua • a/15 spatial resolution • Several ms time resolution • (ROI mode) • Accurate and stable photometric calibration • Simple and compact Imaging slit Entrance slit
Operation of TGIS on NSTX TGIS view on NSTX • CX lines are observed to peak in the • region with high neutral s from beam • (shown in blue) • Emission from medium Z impurities • (Cl/Fe), is broad and extends to the • core Region of intense beam emission plasma axis C 4-3 (CX) Traces of Cl Traces of Fe 335 A: Fe XVI TGIS Bright CX signals from Li, C, N, O
Spectra from ohmic shot (edge emission) illustrates spatial dependence of impurity density
Tokamak W spectra incompletely understood ITER W spectrum (Pütterich et al 2008) core pedestal 10 edge, divertor W47-56 (Ar-Co like) W57-65 (F-Cl like) W38-46 (Kr-Ni like) 5 W24-37 (Sn-Rb like) W3-26 (Lu-Cd like) l (nm) 0.1 1 10 Poor So and so Ok ~ Ok • W will play critical role in ITER performance (nW< few 10-5 ne) • XUV W spectrum yet poorly understood, while critical for real-time divertor and main plasma purity control
Goals for C-Mod W experiments Example of FTU W accumulation spectra (Te0 ~600 eV) #30651 #30649 l (nm) l (nm) • Some spectra resemble prediction, but large variability in spectral features, shape. Very sensitive to ne, Te. • The spectra is inherently messy and models need to be validated. • Few Å resolution over ~30-500 Å spectral range is adequate for W XUV spectroscopy. • Goal: Use the SPACE and time resolving capability of TGIS to measure W XUV spectra from plasmas with known Te, transport profiles Sn to Cd-like l (nm)
Impurity accumulation in the core is clearly observed The radiated power is very high because of impurity accumulation Exposure time of spectra Accumulation in the core