Download
1 / 34
340 likes | 706 Views
Measuring Coding Accuracy. Artificial Intelligence in Medicine National Cancer Institute. Project. This project was funded in part by Contract Number 263-MQ-514922 from the National Cancer Institute Participating registries Kentucky Cancer Registry Los Angeles Cancer Registry

E N D
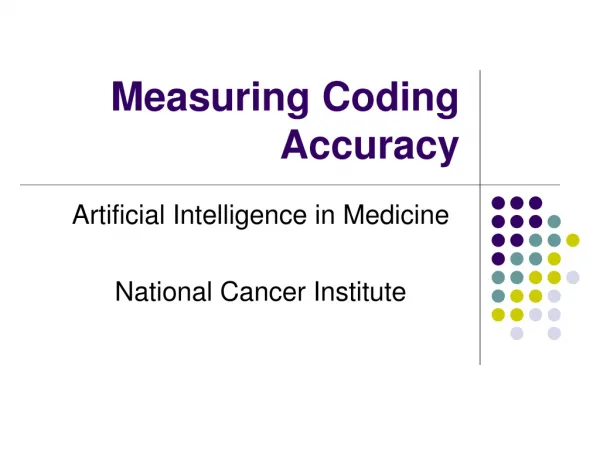
Measuring Coding Accuracy Artificial Intelligence in Medicine National Cancer Institute
Project • This project was funded in part by Contract Number 263-MQ-514922 from the National Cancer Institute • Participating registries • Kentucky Cancer Registry • Los Angeles Cancer Registry • Atlanta Cancer Registry • New Jersey Cancer Registry
Objective • Develop a software tool that measures the accuracy of an automated coding system against a reference data set. Sub-tasks • Define a coding accuracy model. • Create a software tool that accepts input from any automated coding system to produce accuracy data.
Automated coding CLINICAL HISTORY/MACROSCOPY Right mastectomy and axillary tissue. A right mastectomy specimen with overlying skin measuring 220mm x 85mm and underlying breast tissue measuring 220mm x 100mm x 70mm. The axillary tail measures 125 x 60mm. The nipple is slightly retracted and located centrally. The superior margin is painted red, the inferior margin painted green and the deep cut margin is painted blue. Cut sections of the underlying breast tissue shows an ill-defined grey white yellow lesion with patchy areas of haemorrhage measuring 35 x 35 x 35mm located immediately below the nipple, 20mm from the inferior margin, 45mm from the deep cut margin, 50mm from the superior margin, 85mm from the medial margin and 100mm from the lateral cut margin. A1 - nipple, B1 - upper outer quadrant, C1 - upper inner quadrant, D1 - lower outer quadrant, E1 - lower inner quadrant, F1, G1 - tumour composite blocks, H1, I1 - tumour composite blocks, J1 - deep cut margin, K1 - superior margin, L1 – inferior margin, M4 - lymph nodes, N4 - lymph nodes, O - 3 serial slices, lymph node, P - 3 lymph nodes. MICROSCOPY This right mastectomy specimen demonstrates an invasive ductal carcinoma with the following pathological features: TUMOUR HISTOLOGY & GRADE The tumour is of an infiltrating poorly differentiated ductal carcinoma of non-otherwise specified type. The tumour is poorly defined and extremely infiltrative, comprising poorly-formed tubules, nests or strands of cuboidal tumour cells displaying high grade nuclei. The tumour cells are set within fibrotic desmoplastic stroma. Many lactiferous ducts are entrapped within the tumour. Frequent tumour mitoses are seen. Microcalcification is seen in some neoplastic tubules. Tumour grade (Modified Bloom-Richardson Scoring System): Tubular formation: 3 Nuclear atypia: 3 Tumour mitoses: 2 Total score: 8 (Grade III) TUMOUR LOCATION, SIZE AND EXTENT The tumour is located 5mm below the nipple and has a macroscopic size of 35mm across. The border of the tumour is poorly circumscribed and infiltrative. INTRA-LYMPHOVASCULAR OR PERINEURAL TUMOUR PERMEATION Focal intralymphatic tumour permeation is noted. No perineural tumour invasion is seen in sections submitted. M-80103 M-85003 M-80003 C50.9 C77.9
What is measured? • Sensitivity, specificity, reducibility and confidence • Of a single code, either (topography) or (morphology) • Of a pair of codes (topography, morphology)
Notation: Adenocarcinoma “M-81403” as the subject code 6 Possibilities
S O:X+O Note: The labeled areas include only the portions that are bounded by the arcs, not the entire circle. Q O:O B X:O C X:X+O A X:X R O:X Definitions Venn Diagram
S O:X+O Note: The labeled areas include only the portions that are bounded by the arcs, not the entire circle. Q O:O B X:O C X:X+O A X:X R O:X Definitions Venn Diagram
Definitions Venn Diagram
S O:X+O Note: The labeled areas include only the portions that are bounded by the arcs, not the entire circle. Q O:O B X:O C X:X+O A X:X R O:X Definitions Venn Diagram
S O:X+O Note: The labeled areas include only the portions that are bounded by the arcs, not the entire circle. Q O:O B X:O C X:X+O A X:X R O:X Definitions Venn Diagram
S O:X+O Note: The labeled areas include only the portions that are bounded by the arcs, not the entire circle. Q O:O B X:O C X:X+O A X:X R O:X Definitions Venn Diagram
S O:X+O Note: The labeled areas include only the portions that are bounded by the arcs, not the entire circle. Q O:O B X:O C X:X+O A X:X R O:X Definitions Venn Diagram
S O:X+O Note: The labeled areas include only the portions that are bounded by the arcs, not the entire circle. Q O:O B X:O C X:X+O A X:X R O:X Definitions Coding accuracy measures Sensitivity = (A+C) / (A+B+C) How often is the reference code returned in those reports where it is the subject code. Specificity = Q / (Q+R+S) How often is the subject code not returned in those reports where it is not the reference code. Reducibility = (A+R) / (A+R+C+S) How often is the subject code the only code identified when the code is identified. Confidence = A / (A+R) How much confidence can we place in the result.
S O:X+O Note: The labeled areas include only the portions that are bounded by the arcs, not the entire circle. Q O:O B X:O C X:X+O A X:X R O:X Definitions Coding accuracy measures Sensitivity = (A+C) / (A+B+C) How often is the reference code returned in those reports where it is the subject code. Specificity = Q / (Q+R+S) How often is the subject code not returned in those reports where it is not the reference code. Reducibility = (A+R) / (A+R+C+S) How often is the subject code the only code identified when the code is identified. Confidence = A / (A+R) How much confidence can we place in the result.
S O:X+O Note: The labeled areas include only the portions that are bounded by the arcs, not the entire circle. Q O:O B X:O C X:X+O A X:X R O:X Definitions Coding accuracy measures Sensitivity = (A+C) / (A+B+C) How often is the reference code returned in those reports where it is the subject code. Specificity = Q / (Q+R+S) How often is the subject code not returned in those reports where it is not the reference code. Reducibility = (A+R) / (A+R+C+S) How often is the subject code the only code identified when the code is identified. Confidence = A / (A+R) How much confidence can we place in the result.
S O:X+O Note: The labeled areas include only the portions that are bounded by the arcs, not the entire circle. Q O:O B X:O C X:X+O A X:X R O:X Definitions Coding accuracy measures Sensitivity = (A+C) / (A+B+C) How often is the reference code returned in those reports where it is the subject code. Specificity = Q / (Q+R+S) How often is the subject code not returned in those reports where it is not the reference code. Reducibility = (A+R) / (A+R+C+S) How often is the subject code the only code identified when the code is identified. Confidence = A / (A+R) How much confidence can we place in the result.
Source Data Source Data Coded Pathology Reports Coded Pathology Reports Reference Reference Codes Codes Data Data Accuracy Accuracy Display Display Comparison, Comparison, Calculations Calculations Accuracy Accuracy Spread Sheets Spread Sheets Matching Matching Data Data & Graphs & Graphs and Analysis and Analysis Automated Automated Coding Coding System System SQL Database SQL Database SQL Data Base With Query Assist SQL Data Base With Query Assist Machine Machine Generated Generated Codes Codes Input Input CODAC CODAC Output Output Data Flow
Software description • Written in C#, uses latest .NET technology • Runs on Standard Pentium workstation • Imports and exports (CSV). Files can be edited with use text editor or Excel • Optional Links to SQL database engine • The performance of any automated coding system can be measured by using the specified data format
Software operation • We ran 17128 pathology reports through the software. • Software automatically calculates accuracy parameters by comparing reference data to test data.
Example of high confidence • M-81403 (Adenocarcinoma) • Sensitivity 0.82 • Specificity 0.90 • Reducibility 0.08 • Confidence 0.87 • Reference count 2647=15%
Example of high confidence • M-81403 ,C61.9 (Adenocarcinoma, Prostate) • Sensitivity 0.87 • Specificity 0.99 • Reducibility 0.06 • Confidence 1.00 • Reference count 1008=6%
Example of low confidence • C44.9 (Skin) • Sensitivity .57 • Specificity .76 • Reducibility .05 • Confidence .03 • Reference count 67 =.4%
An Experiment • Modify AutoCode to produce output as follows: Take the largest morphology value Take the smallest topography value Example: Reduce M-82403 M-80001 C17.0 C16.9 C17.9 To M-82403 C16.9
Wrap Up • Created a coding accuracy measurement system • Applied to AIM’s AutoCode, but can be used to measure any coding system. • Software available to public domain