Download
1 / 23
230 likes | 364 Views
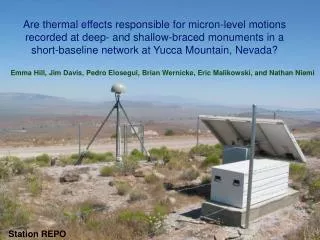
Are thermal effects responsible for micron-level motions recorded at deep- and shallow-braced monuments in a short-baseline network at Yucca Mountain, Nevada?. Emma Hill, Jim Davis, Pedro Elosegui, Brian Wernicke, Eric Malikowski, and Nathan Niemi. Station REPO. Introduction. Baseline lengths

E N D
Are thermal effects responsible for micron-level motions recorded at deep- and shallow-braced monuments in a short-baseline network at Yucca Mountain, Nevada? Emma Hill, Jim Davis, Pedro Elosegui, Brian Wernicke, Eric Malikowski, and Nathan Niemi Station REPO
Introduction Baseline lengths SLI4-SLID (Slide Mtn): 0 mREPO-REP2: ~10 mREPO-REP3: ~100 mREPO-REP4: ~1000 m (Similar instrumentation) Blue dots = BARGEN sites • Southern Nevada • Desert environment • ‘Low’ tectonic rates
Data Processing • Data processed using GAMIT: • Fixed orbits (IGS final) • No TZD estimation • L1-only position estimates • Only look at baselines • Site-specific effects: • Phase errors • Un-modeled physical motions Photo by Beth Bartel
Time Series - East Short baseline Annual cycles: 0.03-0.54 mm RMS: 0.06-0.20 mm Zero baseline (ZBL) RMS: 0.03 mm Time series have been offset for illustration RMS calculated about model of seasonal cycle
Time Series - North Short baseline Annual cycles: 0.02-0.19 mm RMS: 0.06-0.23 mm Zero baseline (ZBL) RMS: 0.03 mm
Time Series - Radial Short baseline Annual cycles: 0.10-0.40 mm RMS: 0.12-0.73 mm Zero baseline (ZBL) RMS: 0.08 mm
Temperature Data Temperature data was obtained from the Beatty weather station (~25 km NW of Yucca Mountain)
Longer-period Signals REP2-REPO (~10 m baseline) For illustration, the north component time series has been reversed (i.e. figure shows REPO-REP2 for the north) “Longer-period” signals (quasi-periodic) = Gaussian-filtered time series
Correlation coefficient Longer-period Signals Cross-correlation between temperature and GPS time series Correlation coefficients: East = 0.74-0.98North = 0.45-0.93Radial = 0.55-0.76 REP2-REPO REP4-REPO The GPS seasonal cycles might lag those of the temperature data, but it is hard to detect using this method.
Monte Carlo Analysis Add noise to GPS and temperature time series Gaussian filter to get long- and short-period signals Cross-correlation as before Record peak correlation and corresponding time step Repeat 5000 times
Longer-period Signals Monte Carlo analysis (cross-correlation between temperature and GPS) EAST: Similar results for all other baselines to REP4 (no lag for shorter baselines). NORTH: Similar results for all other baselines to REPO (no correlation for other baselines). Indicates a lag (15-30 days) for many baselines in the horizontal component…
Longer-period Signals … but we do not see a lag for the radial component. The temperature ‘lags’ the GPS by >50 days. Although there is a correlation for the radial, it looks like we are comparing two periodic signals that do not appear to be related.
Shorter-period Signals REP2-REPO (~10 m baseline) “Shorter-period” signals = residuals from Gaussian-filtered time series
Correlation coefficient Shorter-period Signals REP2-REPO (~10m) REP3-REPO (~90 m) … and Monte Carlo technique indicate no lag time for short-period signals Both regular cross-correlation… Highest correlation (0.67) for the east component and baselines to REP2 (shallow-braced monument)
Thermal Expansion Several processes occurring at different time-scales? • Cliff / Bedrock (longer-period?) - Dong et al. [2002] estimate ~45 day lag - Differential effects from orientation of ridgeline? Steep cliff • Upper ground layers (shorter-period?) - Deep versus shallow-braced monuments Gradual slope • Monument (shorter-period?) - Different leg lengths and orientation - REP2 different type of pipe • Something else? Red = longest legGreen = shortest leg
~0.2 mm/km ~0.3 mm/km ~0.8 mm/km Baseline-dependent Noise (and what is causing the seasonal cycles in the radial?) Orbits? ~0.002 mm over 1 km (assuming 5 cm accuracy of IGS final orbits) Troposphere? Ionosphere? Multipath?
Tropospheric Delay REP4-REPO • When TZD parameters are estimated: • Time series for horizontal components are very similar. • But seasonal cycles in the radial component are reduced by ~50% for the longer baselines. No TZD estimation With TZD estimation A mean has been removed from both time series
Ionospheric Delay • When LC is used: • Time series are considerably noisier and have visible receiver change offsets. • Seasonal signals remain. REP4-REPO L1-only LC Differences between L1- and L2-only (Receiver changes at REP4, Jan and Nov 2007 (NetRS to 4000 SSI to NetRS) A mean has been removed from both time series REP4-REPO
Elevation-Angle Dependence Time series from results using different elevation cutoff angles are offset. Largest effect in radial component. • Multipath? • Antenna differences? REP3-REP2 (~10m) REP4-REP2 (~900 m) Y-axes have different scales
Conclusions • The sites appear to be very stable (RMS 0.06-0.73 mm). However, the time series do show both seasonal (annual amplitude 0.03-0.54 mm) and shorter-period signals. • We suspect the horizontal seasonal signals may be related to bedrock thermal expansion (they are correlated with temperature, but with a lag time of ~15-30 days), but this is not the case for the radial component (instead atmosphere/multipath?). • Shorter-period signals are correlated with temperature, mainly for the east component and particularly for REP2 (the short-braced monument). We suspect this could be thermal expansion of the monument or upper ground layers (or both).
Rates REP3-REPO (~100 m) (east) 0.06 ± 0.01 mm/yr REP3-REP2 (~90 m) (north) -0.07 ± 0.01 mm/yr REP4-REP3 (~1 km) (north) -0.24 ± 0.01 mm/yr
Elevation-Angle Dependence Mean annual amplitude Reduction in annual amplitude for the radial component with higher elevation angle cutoffs.