Download
1 / 15
150 likes | 293 Views
A simple method for supporting future landers by predicting surface pressure on Mars. Paul Withers Boston University 725 Commonwealth Avenue, Boston MA 02215, USA (withers@bu.edu) PS08-A021 Thursday 2009.08.13 11:00-12:30 AOGS Meeting, Singapore. How to land on Mars.

E N D
A simple method for supporting future landers by predicting surface pressure on Mars Paul Withers Boston University 725 Commonwealth Avenue, Boston MA 02215, USA (withers@bu.edu) PS08-A021 Thursday 2009.08.13 11:00-12:30 AOGS Meeting, Singapore
How to land on Mars Spirit and Opportunity shown here, similar systems used by other landers
If actual surface pressure is much smaller than estimated Lander does not have enough time to perform steps necessary for safe landing
If actual surface pressure is much larger than estimated Mass devoted to landing system can be reduced, used for scientific instruments instead Very long time descending slowly on parachute
Surface pressure varies with season Atmosphere of CO2 freezes onto polar cap in winter hemisphere
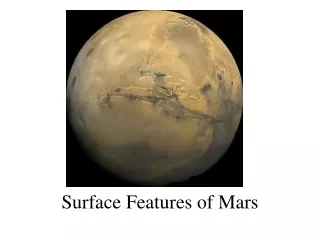
Surface pressure varieswith position Altitude of surface varies by three atmospheric scale heights or >30 km
Viking surface pressure data 10 mbar 7 mbar Ls=0 Ls=0 Ls=0 Ls=0
Estimating surface pressure for MSL’s landing • Other scientists are developing very sophisticated climate models • I focus on a simple expression for Ps derived from data • Transparent • Easy to use • Quantify accuracy easily • Reality-check for more complex predictions • Ls=120-180, z<+1 km, 45S-45N
LANDERS Viking Lander 1 (VL1) Multiple years, coarse digitization, 22N Viking Lander 2 (VL2) Almost one year, coarse digitization, 48N Mars Pathfinder (MPF) Ls=142-188, same elevation as VL1, systematic error of about 0.1 mbar, 19N Phoenix (PHX) Ls=76-151, 68N, large and precise dataset Data from Ls=120 to 151 not yet incorporated into analysis RADIO OCCULTATIONS Mariner 9 Apparent inconsistencies of 10% Viking Orbiters 1/2 (VO1/2) Barely 20 pressures reported Mars Global Surveyor (MGS) 21243 profiles, including 297 at Ls=120-180, z<+1 km, latitude=45S to 45N Extrapolate p(r) to MOLA surface and assign MOLA altitude Mars Express (MEX) 484 profiles, only 5 at Ls=120-180, z<+1 km, latitude=45S to 45N Available Datasets Most useful datasets are: VL1 for seasonal cycle, MGS for validation and testing, Goal is: Simple expression for DIURNAL MEAN Ps as function of season and altitude.
Approach Grey line is 360 diurnal mean surface pressure from VL1 Black line is wave-2 fit Use expression below to predict surface pressure, Ps zVL1 = -3.63 km Constant and uniform H0 needed (found on next slide) Eqn 1 Optimize with Delta metric, where Delta = (p-pred – p-meas) / p-meas
Finding H0 from MGS • Quickly find that H0<10 km and H0>12 km have problems at low and high altitudes • MGS measurements at z<+1 km and 45S to 45N divide neatly into seven Ls blocks Optimal scale height is: H0 = 11 km Equivalent to T=215 K, which is reasonable
Accuracy of Predictions Expect 3% accuracy for MSL landing with 1-sigma confidence level Overbar = Mean S. D. = Standard deviation Only data from z<+1 km and 45S to 45N used for orbital datasets
Potential Applications • First-order surface pressure estimates for landing site selection • Reality-check on predictions from more complex, physics-based models • Total atmospheric mass from Eqn 1 is about 10 p0R2 f(Ls) / g. Annual mean value is 2.4E16 kg and difference between maximum and minimum values is 6.6E15 kg, consistent with previous results. • Correct orbital gamma ray and neutron spectrometer for atmospheric absorption effects • Absolute altitude scales for T(p) profiles measured from orbit, such as MGS TES or Mariner 9 IRIS profiles • Theoretical simulations of dust lifting and aeolian modification of surface features, the thermodynamic stability of near-surface liquids, and the surface radiation environment
Conclusions • A simple expression with 7 free parameters provides surprisingly accurate predictions for surface pressure • Expected accuracy of prediction for MSL landing is 3% (1-sigma confidence level) • Predictions are least accurate at Ls=240 to 360 when interannual variability (large dust storms) is greatest • There are many potential applications for accurate surface pressure predictions