Download
1 / 54
560 likes | 1.17k Views
Water Use Efficiency Studies of Major & Medium Irrigation Projects. Objectives. Evaluation of the following efficiencies. Dam Efficiency (inflow and release pattern) Delivery System / Conveyance efficiency. On farm application efficiency. Drainage efficiency

E N D
Water Use Efficiency Studies of Major & Medium Irrigation Projects
Objectives Evaluation of the following efficiencies. • Dam Efficiency (inflow and release pattern) • Delivery System / Conveyance efficiency. • On farm application efficiency. • Drainage efficiency • Irrigation potential created & utilized.
Constitution of TAC for Evaluation Chairman – Member (wp&p), CWC Vice Chairman – Commissioner (CAD&WM) MOWR. Member Secretary – Director (IPO), CWC. Members: • Chief Engineer (PO MIO), CWC • Commissioner (PP), MoWR • Financial Advisor, MoWR. • Dy. Commissioner (WM), Ministry of Agriculture. • Asst. Director General, ICAR. • Joint Advisor (Water Resources) Planning Commission. • Member (SML), Central Ground Water Board. • Chief Engineer of Concerned project • Director IP(N/S). • Director, EWV, CWC.
Dam / Reservoir Efficiency (ER) The Maximum live storage attained during a year ER= ______________ Designed live storage
Delivery system / Conveyance Efficiency (EC1)& water delivery system efficiency(EC2) EC1=Total water delivery at inlet to the block of fields Water released at the project head work canal conveyance efficiency. EC2=Actual water carrying capacity of all canals Designed Capacity of all Canals • For main canal & Distribution-discharge >150 C/S. • For Distribution network-discharge < 150 C/S. • For both lined & unlined canals. • Sample representing from head / Middle / Tail ends.
Data to be collected • Designed carrying capacity of all the canals. • Actual Carrying capacity of all the canals. • Seepage in various reaches of various canals. • Evaporation losses in various canals.
On farm Application Efficiency(Ef) Water used by crop to meet evapo- transpiration needs. Ef = --------------------------------------------------------------------------- Water Delivered to the field.
On farm Application efficiency Data to be collected • Actual cropping pattern, type and coverage. • Weighted average rainfall in the command • Reference evapo-transpiration in the area. • Crop coefficient in respect of various crops • Effective rainfall in the command. • Percolation losses in paddy fields. • Gross, field and Net irrigation requirements.
Drainage Efficiency (Ed) Wd Ed = ------------------ (Ws+ Re-Et) Wd = Total water drained from the system Ws = Total water supplied to the system. Re = Effective rainfall during the period under consideration. Et= Water used by crops to meet evapo- transpiration needs.
Drainage efficiency Data to be collected • Total amount of water released to various fields in the command area. • Amount of water required by various crops • Amount of water drained out from the command area after fulfilling need of various crops. • Adequacy & performance of existing drainage system.
Irrigation Potential Created (IPC)& Irrigation Potential Utilised (IPU) Irrigation Potential Created (IPC): The irrigation potential created by a project at a given time during or after its construction is the aggregate gross area that can be irrigated annually by the quantity of water that could be made available by all the connected and completed works upto the end of the water courses or the last point in the water delivery system. It is the area that can be irrigated from a project in a design agriculture year, that is, from the 1st July to 30th June next year for the projected cropping pattern and accepted water allowance on its full development. Before an area is included under potential created, it has to be ensured that the water for the area to be reported upon is available and the conveyance system upto and including the irrigation outlet to serve an area up to 40 hectares in the area to be irrigated is completed. Irrigation Potential Utilised (IPU): The irrigation potential utilised is the total area for which water is actually delivered to the outlet upto 40 hectare blocks as planned.
Format for Report on Water Use Efficiencies (Chapter 1 to 7 as given below) Contents Chapter-1 Project Details 1.1. Introduction including objective of the studies 1.2. Project - Salient features 1.3. Index Map Chapter-2 Dam/Reservoir Efficiencies 2.1. Hydrology . 2.1.1 75% annual dependable flows (designed! anticipated) 2.1.2 Actual 75% dependable annual flows 2.1.3 I inflow pattern on ten daily I monthly basis 2.1.4 Water spillage . 2.2. Evaporation losses in the reservoir 2.3. Seepage losses from the reservoir 2.4 Calculation and presentation of Efficiencies in tabular form
Chapter-3Canal/Conveyance Efficiencies 3.1. Canal Capacity 3.1.1 Designed carrying capacity 3.1.2 Actual carrying capacity 3.2. Seepage in various reaches of various canals 3.3. Evaporation losses in various canals 3.4. Calculation and presentation of Efficiencies in tabular form in 2 parts as given below (a) For canals having discharge more than 150 cuse6 (b) For canals having discharge upto 150 cusec Chapter-4 On Farm Application Efficiency 4.1. Cropping pattern 4.1.1 Designed cropping pattern 4.1.2 Actual cropping pattern 4.1.3 Comparison 4.2. Weighted average rainfall in the command of the project 4.3. Reference evapotranspiration in the area under study 4.4. Crop co-efficient respect of various crops 4.5. Effective rainfall in the command 4.6. Percolation losses in paddy fields 4.7. Ground Water component 4.8. Gross irrigation requirement 4.9. Field irrigation requirement 4.10 Net irrigation requirement 4.11 Calculation and presentation of Efficiencies in tabular form
Chapter-5 Drainage Efficiency 5.1. Total amount of water released to various fields 5.1.1 Surface Water 5.1.2 Ground Water 5.2 Amount of water required by various crops 5.3 Amount of water drained out from the command area 5.4 Adequacy and performance of existing drainage system 5.5. Need for external drainage system, if any 5.6. Problems of water logging, salinity, alkalinity, if any 5.7. Calculation and presentation of Efficiencies in tabular form Chapter-6 Potential created and Utilized 6.1 Year wise Potential Creation 6.2 Year wise Potential Utilization Chapter-7 Findings and Recommendations 7.1. Recommendation for improvement in Water Use Efficiencies 7.1.1. Dam/Reservoir efficiency 7.1.2. Canal/Conveyance efficiency 7.1.3. On Farm application efficiency 7.1.4. Drainage efficiency
Project Selection Criteria • Different basins • Different Agro-Climatic zones.
Checking the results • Remote Sensing Technology to be used.
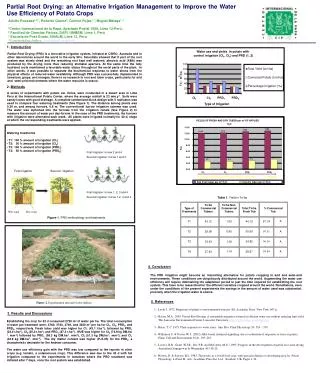
Project details • River : Vamsadhara • Type of project : Major Irrigation / Inter state project. • Type of Structure : Barrage. • Location : Srikakulam(Dt) • CCA : 59,987 ha(1,48,230 acres) • Ultimate Irrigation • Potential : 59,987 ha(1,48,230 acres) • Potential Created : Stage I Stage II 59,987 Ha 82,087 Ha • Potential utilized : 82,087 Ha (upto 2006)
Salient features: 1. Hydrology. • Catchment area - 9,371 Km2 • Mean Annual rainfall - 1,914 mm • Average monsoon - 1,067mm rainfall. • Maximum flood - 6,764 m3/Sec discharge observed • Total Yield - 115 Tmc • Share of A.P. - 50% • 75% dependable annual - 70.452 Tmc(1994 Mcum) yield • Share of A.P. - 35,226 Tmc(997 Mcum) • Stage I utilization - 17.841 Tmc (505 Mcum) • Storage capacity - 17.33 Mm3
2. Barrage: • Length : 475.79 m • Spillway bays: 22 Nos. (18.29 m x 4.75 m) • Scorring sluices: 2 (12.19mx 4.88 m)
Dam / Reservoir Efficiency(Barrage) • Water Spillage : Increasing trend • Evaporation losses: Negligible • Seepage losses : Nil • Success Indicator : Surplus in all years considered
3. Canals: LMC No. and size of vents: 2.44 m x 2.44m – 9 Nos. Length of Canal : 107.80 Km Carrying capacity : 70.23 M3/s (2480 c/s) (Des)
CANAL CHOSEN Name of the Canal : 48RL.M.C Discharge : above 150 cusecs Reach : Head reach Details of Reach : Km 0.00 to km 2.00 Canal losses : 6.23 m3/s/ M. sqm. (Seepage losses) Conveyance efficiency : 90.50%
CANAL CONVEYANCE EFFICIENCY • Seepage losses • FORMAT – A • I. Identification Particulars: • 1. Name of the Project : Vamsadhara Project Major/Medium : Major Irrigation Project • 2. Circle : Vamsadhara Project Circle, Srikakulam • 3. Division : Vamsadhara Project Division, Srikakulam. • 4. Nature of Field Studies : Measurement of seepage loss of Distributary by Inflow-Outflow method. • 5. Particulars of canal reach: ; 48R of L.M.C (i) Main canal / Distributary : Distributary (ii) Lined / Unlined : unlined (iii) Discharge above 150 C/s : above 150 Cusecs. Discharge below 150 C/s (iv) Length of reach : From km 0.00 to km 2.00 6. Crop season details : : Khariff • 7. Duration of Field Studies : on 22.12.2006 Cont.
II.FIELD OBSERVATIONS • DATA SHEET • Measurements of Discharge at upstream control • Point @ CH 0.00 • Using Current meter :1.505 Cumecs. 2. Discharge @ intermediate openings • & off taking channels. (i) Pipe outlets : NIL Cont.
Off taking Channels : NIL. 3. Measurements of Discharge at down stream Control point @ 2.00 km. Using Current meter : 1.362 Cumecs 4. Seepage loss = 1 – 2 – 3 = 1.505-1.362 = 0.143 Cumeces Cont.
Wetted perimeter of section 6. Seepage losses in Cumes / Million Sq Metres = 0.143 X 106 = 6.23 Cumecs/Msqm. 22936 7.Conveyance efficiency: Quantity of water delivered at various outflow points and end d/s point Quantity of water as received at u/s control point. = 1.362x100 = 90.50% 1.505 Cont.
Canal Conveyance Efficiency • Designed carrying Capacity : 70.23 M3/s of LMC at head reach (2480 C/s) • Actual Carrying capacity : 50.96 M3s (1800 c/s) Canal Chosen Distributory of LMC (48 R of LMC) Length : 2 KM Canal Conveyance efficiency : 90.50% Table at
On Farm Application Efficiency • Designed Cropping Pattern : Paddy • Actual Cropping Pattern : Paddy • Weighted average rainfall : 973.6mm
Drainage Efficiency • Water released : 503.79 Mm3 • Crop Water requirement : 599.79 Mm3 • Drainage Efficiency : Not realizable
Duty Realized • Maximum : 218.61Ha/Mm3 15 Acres /Mcft. • Minimum : 128.04 Ha/MM3 9 Acres / Mcft. • FOs : DCs-8 WUAs - 64
CANAL 40R( LESS THAN 150 CUSEC CAPACITY) SELECTED FOR CONVEYANCE EFFICIENCY STUDY.