ThyssenKrupp Group
460 likes | 949 Views
The Fifth Annual CERT CEO Roundtable Presentation held by Gary Elliott, CEO ThyssenKrupp Elevator AG and Member of the Executive Board ThyssenKrupp AG Berlin, October 18, 2005. ThyssenKrupp Group. ThyssenKrupp AG. Group sales: €39.3 bn • EBT : €1,580 m • Employees: 184,000

ThyssenKrupp Group
E N D
Presentation Transcript
The Fifth Annual CERT CEO RoundtablePresentation held byGary Elliott, CEO ThyssenKrupp Elevator AGand Member of the Executive Board ThyssenKrupp AGBerlin, October 18, 2005
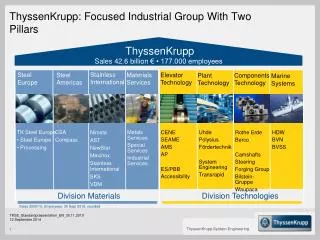
ThyssenKrupp Group ThyssenKrupp AG Group sales: €39.3 bn • EBT: €1,580 m • Employees: 184,000 all figures 2003/2004 (consolidated) Services Automotive Technologies Elevator Steel Stainless Sales: €7.3 bn EBT: €288 m Employees: 43,000 Sales: €5.1 bn EBT: €67 m Employees: 28,000 Sales: €3.6 bnEBT: €370 m Employees: 32,000 Sales: €11.9 bn EBT: €271 m Employees: 33,000 Sales: €8.3 bn EBT: €588 m Employees: 31,000 Sales: €5.0 bn EBT: €385 m Employees: 12,000 • Plant Technology • Marine Systems • Mechanical Engineering • Transrapid • Body & Chassis (North America) • Body & Chassis(Europe/Asia Pacific/Latin America) • Powertrain (Global) • Materials Services Europe • Materials Services North America • Industrial Services • Special Products • 4 regional business units • Escalators/Passenger Boarding Bridges • Accessibility • Steelmaking • Processing Industry • Processing Auto Steel Capital Goods Services
Organization and Key Figures Segment structure ThyssenKrupp Elevator AG Gary Elliott, Dr. Joachim F. Panek , Dr. Helmut Pfleger Strategic Advisory Committee G. Elliott, Dr. J. F. Panek, Dr. H. Pfleger, J. del Pozo, H. Müller, B. Pletch, R. Sotomayor, P. Walker Central/ Eastern/ Northern Europe Americas Asia/ Pacific Escalators/ PassengerBoardingBridges Accessi-bility Southern Europe/Africa/Middle East Ramón Sotomayor Helmut Müller Javierdel Pozo Barry Pletch Peter Walker Christian Fröhlich
Organization und Key Figures Elevator segment Central/Eastern/Northern Europe Southern Europe/Africa/Middle East Americas Asia/Pacific Escalators/Passenger Boarding Bridges Accessibility Order intake €4.1 billion Sales €3.7 billion EBITDA €446 million* Income* €370 million* Workforce 33,000 * Key figure 2003/2004
Products and ServicesFull range from a single source Escalators/moving walks Elevators Escalators for all applications Suspended escalators (London Underwriting Centre, London) Moving walks for all applications Traction elevators - with/without gears - with/without machine room - with/without shaft pit - two cabs in one shaft (TWIN) Hydraulic elevators Freight elevators
Products and ServicesFull range from a single source Passenger boarding bridges Accessibility Stairway lifts for all households Platform lifts in buildings for wheelchairs Elevators for private residential buildings Special elevators for disabled persons Passenger boarding bridges for all applications Innovative glass-encased boarding bridges Options: air conditioning, power, supplies to aircraft etc.
World Market for Elevators and EscalatorsMarket shares of overall market for elevators and escalators (query 2004) Volume: €30 bn Otis Schindler ThyssenKrupp Mitsubishi Kone Hitachi Toshiba Fujitec Others (in %)
Business Model Value added circle in the elevator business Technology Attendance along the lifecycle Attractive margins by technologybased customer relationship + Technology for long-term customer relationship Experience for technical innovations Maint. / Repairs Modern- ization Research Development Production Sale Installation Removal Image improvement Classical service =
World Market for Elevators and EscalatorsEstimated number of new installed elevators (query 2004)
References Germany Commerzbank Tower, Frankfurt Europe’s tallest office building Building height: over 300 m (incl. superstructure) 56 floors 30 ThyssenKrupp elevators Maximum rise: 200 m Maximum elevator speed: 6 m/s Architect: Sir Norman Foster & Partner
References Germany DaimlerChrysler (“Kollhoff Building”), Potsdamer Platz, Berlin Europe’s fastest elevator Building height: 101 m 23 floors Elevator rise: 90.1 m Maximum elevator speed: 8.5 m/s Travel time: 20 seconds Architect: Kollhoff und Timmermann
References China Shanghai World Financial Center Next highest building of the world Building height: 492 m 101 floors 42 elevators Thereof 4 double-deck elevators Speed double-deck elevators: 10 m/s Completion in 2007
Products und Services R&D project TWIN: Multiple use of elevator shafts Two independent cabins in one shaft Saves building space, reduces waiting time, increases traffic handling Permits buildings with more than 100 floors Destination Selection Control Cabs on top of each other Counterbalances
References TWIN BMW Group Headquarter, Munich Oceanic Center, Valencia Federation Tower, Moscow 4 TWIN-Systeme 11 TWIN-Systems 1 TWIN-System
References United Arabic Emirates Dubai International Airport 100 Mio US$ for the installation of elevators, escalators and moving walks 368 elevators - 162 escalators – 128 moving walks 50 Mio US$ for the installation of 123 passenger boarding bridges 25 of them for the new Airbus A380
References Toronto, Canada Pearson International Airport , Toronto 80 Mio CA$ for the installation of elevators, escalators, moving walks and passenger boarding bridges 135 elevators - 25 escalators – 4 moving walks – 95 passenger boarding bridges
ReferencesElevator World - Project of the Year 2004 Glass-walled elevator in a Nickel Mine Shaft, Science Center Dynamic Earth in Sudbury, Ontario, Canada
ReferencesService contracts in famous buildings around the world • Marriott Putrajaya Hotel Kuala Lumpur, Malaysia • Canary Wharf London, Great Britain • Empire State Building New York, USA • Sydney Opera House Sydney, Australia
Organization und Key Figures Main production sites The segment has over 800 branches and locations in more than 60 countries. Europe Asia / Pacific North and Latin America Elevators Passenger Boarding Bridges Accessibility Escalators
Organization und Key Figures Main production sites North America Elevators Passenger Boarding Bridges Accessibility Escalators
Organization und Key Figures Main production sites Europe Elevators Passenger Boarding Bridges Accessibility Escalators
ThyssenKrupp: 51 companies in the USA (153 locations, total 25,236 employees, thereof 9,000 Elevator) Detroit: Milford Fabricating Comp. (P) ThyssenKrupp Materials NA Inc. ThyssenKrupp Steel North America Inc. TWB Company (P) Troy, MI: Thyssen Krupp USA Inc. ThyssenKrupp Budd Company (P) ThyssenKrupp Budd Systems LLC (P) ThyssenKrupp Automotive Sales & Tech. Cent. Transit America Inc. Grand View, MI: ThyssenKrupp Access Corp. (P) Bannockburn, IL: ThyssenKrupp Nirosta NA Inc. Waupaca, WI: ThyssenKrupp Waupaca Inc (P) Eastpointe, MI; ThyssenKrupp Materials Inc. Fostoria,OH: ThyssenKrupp Atlas Inc. (P) Auburn Hills, MI: J.A.Krause Inc. Nothelfer Gilman Inc. (P) Danville, IL: (P) ThyssenKrupp Gerlach Company Systrand Presta Engine Systems LLC Maumee, OH: ThyssenKrupp Logistics Inc.(P) Puyallup, WA: (P) Olympic Tracks Inc. Waukesha,WI: Berco of AmericaInc. Safway Services Inc. (P) Safway Formworks Systems New Berlin,WI: Defontaine of America Twinsburg, OH: PSL of America Inc. (P) Kingsville, MO: (P) ThyssenKrupp Stahl Company Aurora, OH: Rotek Incorporated (P) New York/Jersey City/New Jersey: ThyssenKrupp AST USA Inc., White Plains, NY ThyssenKrupp VDM USA Inc., Florham Park, NJ (P) New York Elevator & Electrical Corp., NY Computerized Elevator Control Corp., Moonachie, NJ (P) Mainco Elevator & Electr. Corp., Long Island City , NY Mainco Elevator (N.J.) Corp., Edison, NJ Englewood, CO: ThyssenKrupp Robins Inc. (P) Bridgeville, PA: Uhde Corp. of America Reno, NV: (P) Precision Rolled Products Inc. Wilmington, DW: TK Aero Turbine Inc. Whittier, CA: ThyssenKrupp Elevator Corp. (P) Terre Haute, IN: ThyssenKrupp Presta Steer Terre Haute LLC Selma, NC: ThyssenKrupp Precision Forge Inc. (P) Poway, CA: ThyssenKrupp Bilstein of America Inc. (P) Winston-Salem, NC: Advanced Turbine Components, Inc. (P) Fort Worth, TX: ThyssenKrupp Airport Systems Inc. (P) Hopkinsville, Ky: ThyssenKrupp Hopkinsville LLC (P) Colliervielle, TN: ThyssenKrupp Elevator Manufact. Inc.(P) Springfield, TN: ThyssenKrupp Fabco Inc. (P) Ladson, SC: TK Presta SteerTec USA (P) Atlanta, GA: Polysius Corp. (P) Krupp Hoesch Steel Products Inc. Brownsville, TX: Mexinox USA Inc. The Woodlands, TX: Uhde Corp.of America (P)
ThyssenKrupp: sales with customers in the USA 1999 -2004 growth + 1% p.a. in million €
ThyssenKrupp: sales with customers in the USAtotal 7.1 billion € in FY 2003/04 16 % 8 % Elevator 1,162 Technologies 599 24 % Services 1,714 40% Automotive 2,825 12 % Steel 815 in million €
ThyssenKrupp: locations in Canada (4,040 employees) Whitecourt, Alberta: Safway Scaffold Services Inc., Whitecourt Branch Edmonton: Copper and Brass Sales Canada Markham: ThyssenKrupp VDM Canada Ltd., 4 MA Saskatchewan: Safway Scaffold Services Inc., 179 MA Saint John, New Brunswick: Safway Scaffold Services Inc., Saint John Branch Montreal: Ascenseurs Nova Inc. (MBT),28 MA Prince George, B.C.: Safway Scaffold Services Inc., Prince George Branch Mt. Pearl, Newfoundland Safway Scaffold Services Inc., St. Johns Branch Surrey, B.C.: Copper and Brass Sales Canada • Toronto: • TK Northern Elevator Ltd., Scarborough (P), 248 MA • ThyssenKrupp Elevator Canada Ltd. (P), 1.014 MA • Richmond: • Global Steel Services NA • TK Steel Services Sales Office X X • Mississauga: • Elevator Componets Inc. (P), 28 MA • TK Materials CA Ltd., 46 MA • TK Steel Services Sales Office • Global Steel Services Canada NL • Copper and Brass Sales Canada, NL Burnaby, B.C.: Safway Scaffold Services Inc., Burnaby Branch London, Ontario: TK Budd Systems Canada Ltd., 4 MA Kitchener: ThyssenKrupp Budd Canada Inc. (P), 1.642 MA Dresden: ThyssenKrupp Fabco (Werk) Calgary: Krupp Canada Inc., 45 MA Windsor: ThyssenKrupp Fabco Corp. (P), 797 MA Tecumseh: Cross Hueller Canada Ltd., 6 MA Ridgetown: ThyssenKrupp Fabco (Werk)
ThyssenKrupp: sales with customers in Canada 1999- 2004 growth + 3% p.a. in million €
ThyssenKrupp: sales with customers in Canadatotal 696 million € in FY 2003/04 Technologies 79 11 % 21 % Elevator 148 22 % Services 152 31 % 14 % Automotive 216 Steel 101 in million €
ThyssenKrupp: locations in Mexiko (3,111 employees) Cd. de Juarez Mexinox Trading, Ndl. • Tijuana • TK Budd de Tijuana S. de R.L. • TK Budd Servicios S. de R.L. • Mexinox Trading, NdL La Meza Tijuana Monterrey Mexinox Trading, Ndl. Torreón/Coahuila Mexinox Trading, Ndl. • Valle de México • TK Materials Mexico S.A. – 55 MA • Mexinox Trading, Ndl., Tlalnepantla • TK VDM de México S.A., Naucalp. de Juarez – 3 MA • Krupp Presta Servicios de Mexico • Waupaca Foundry de Mexico S.de R.L. • TK Elevadores S.A. – 128 MA • Polysius de Mexico S.A. – 2 MA • Krupp Servicios S.A. – 47 MA • Uhde Jacobs Méxcico S.A. – 207 MA • Uhde Mexico S.A. – 2 MA • Hermosillo • TK Budd de Hermosillo – 22 MA • TK Budd Chassis Servicios Mazatlán/Sinaloa Mexinox Trading, Ndl. • San Luis Potosi • TK Mexinox S.A. – 1.123 MA • Mexinox Trading S.A. • Fischer Mexicana S.A. – 199 MA (MBT) • ThyssenKrupp Sasa S.A. – 462 MA • Servicios Corporativos del Potosi S.A. • Puebla • TK Tailored Blanks S.A., Cuautlancingo – 1 MA • TK Automotive Systems Mexico S.A. – 92 MA • TK Metalúrgica de Mexico S.A. – 441 MA • TK Metalúrgica de Servicios S.A. • TK Presta de Mexico S.A. – 117 MA • LAGERMEX S.A. , Cuautlacingo– 210 MA • Sidcomex S.A., Cuautlancingo Guadalajara Mexinox Trading, Ndl. Queretaro J.A. Krause Mexico S.A. • Silao (Guajanuato) • Aventec S.A. (MBT) • Aventec Mexicana S.A. (MBT) • Aventec Ramos Arizpe S.A. (MBT)
ThyssenKrupp: sales with customers in Mexico 1999– 2004 growth + 26% p.a. in million €
ThyssenKrupp: sales with customers in Mexikototal 630 million € in FY 2003/04 Elevator 8 25 % Automotive 158 1 % Technologies 100 16 % Steel 341 3 % 54 % Services 22 in million €
NAFTA has been advantageous to all of the countries involved • Merchandise trade between the United States and Canada has grown by over 120% • U.S. trade with Mexico has nearly tripled from $81.5 billion in 1993 to $235.5 billion in 2003 • U.S. trade with NAFTA partners grew from $629 billion in 2003 to $712 billion in 2004 • Average growth rate of U.S. trade with NAFTA partners from 1990 to 2004 is 8,3% • Ratio of U.S. trade with NAFTA partners to total U.S. trade was 31.1% in 2004 • Trucks carried over $453 billion worth of goods in trade with Canada and Mexico in 2004, up 12% from 2003 • Rail transborder freight climbed to $108 billion in 2004, up 13% from 2003 • Motor vehicles and parts were the leading commodity groups moved by surface modes with Canada and Mexico amounting to 21% of all surface freight shipments
Did NAFTA help Canada? Yes! • Since 1989, Canada – U.S. trade has nearly tripled from $235.2 billion to $677.8 billion • Canada now exports more manufacturing production to the U.S. than it consumes domestically • Merchandise exports to the U.S. expanded by 250% since 1989 to reach $345.4 billion • Canada and the U.S enjoy the world’s largest bilateral trade relationship: nearly $2.0 billion in goods and services cross the border each and every day
EU NAFTA Comparison NAFTA - EU 3 430 million €10,787 billion €25,060 US$, CAN$, Mex. Peso 2.9% €1,067 billion 1995: 46% 2003: 56% CAN USA 1994: $4.6 billion 2004: $31 billion USA CAN 1994: $6 billion 2004: $22 billion 25 455 million €9,791 billion €22,620 Euro +13 others 2.1% €2,513 billion 1995: 67% (64% intra-EU 15) 2003: 67% (62% intra-EU 15) GER NMS-8* 1994: €1.4 billion 2000: €4.4 billion 2004: €1.2 billion No. of countries Population Total GDP Per capita GDP Currencies Average growth p.a. 1999-2004 Total exports thereof intraregional Direct investments Exports and direct investments within NAFTA have increased strongly since its inception (1994). Most direct investments in Eastern Europe were made in advance of accession. All figures 2004 unless otherwise stated *= New member states excl. Cyprus, Malta
Problems in the EU for Goods Trading and Direct Investment • As the new member states adopted all EU rules and regulations under the terms of their accession, the same framework conditions apply for the movement of goods throughout the Union. • Minor practical obstacles still exist, e.g. due to • continuing exchange rate fluctuations with and between non-euro countries • transport infrastructure bottlenecks (road, rail, ports, airports) • Currently further restrictions on • services • freedom of movement for workers from Eastern Europe • Causes of different conditions for foreign direct investment: • divide in extent and quality of infrastructure (transport, telecommunications, energy) • major differences in labor costs • major differences in tax systems and rates
International Comparison of Labor Costs 28.14 27.60 27.31 25.31 25.01 24.88 23.74 23.32 21.50 21.33 20.74 19.89 18.79 18.76 17.95 17.24 17.15 16.82 16.59 10.42 7.21 4.53 4.49 3.61 3.29
26% 30% 30% 28% 28% 12,5% 0% 25% 25% 16% 15% 26% 19% 15% 10% 19% 33,8% 31,5% 33% 33% 32% 35% 25% 21% German taxation highest in EuropeNominal taxation of stock corporations in Europe 2005 German stock corporations subject to highest nominal and effective taxes in Europe Reduction in tax rates regardless of legal form and harmonization of assessment basis within EU needed 39,5% 30,4% Zypern Sources: BMF, Ernst & Young, KPMG, BDI
NAFTA/EU – Advantages and Disadvantages NAFTA • less languages barriers • more expenditures in R&D(in particular USA) • no seeking for political integration(pure free trade agreement) • no free movement of labor EU • multi-cultural diversity • free movement of labor • perceived bureaucracy (regulations for everything) • long decision processes
Key Messages • Enlargement of free trade reduces protectionism • Protectionism ruins initiatives • Manufacturing in high labor countries can be competitive
Import Duties are Protectionism(e.g. India, Mexico) • No industrial research and manufacturing initiative • investment in machine tools • efficiency gains • employee motivation • R&D expenditures
The World today is becoming flatter • High labor cost countries can be competitive – markets are still local • Reduce direct & indirect labor costs • supply chain management • efficient IT systems • optimize workflow • invest in machine tools • quality branding