PG 2
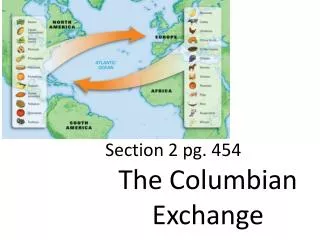
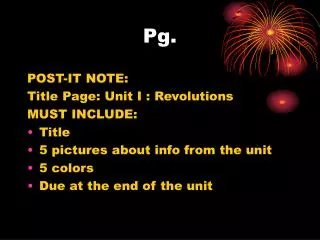
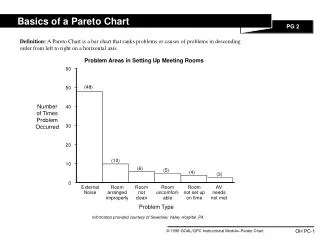
Basics of a Pareto Chart. PG 2. Definition: A Pareto Chart is a bar chart that ranks problems or causes of problems in descending order from left to right on a horizontal axis. Problem Areas in Setting Up Meeting Rooms. 60. (48). 50. Number of Times Problem Occurred. 40. 30. 20.

PG 2
E N D
Presentation Transcript
Basics of a Pareto Chart PG 2 Definition: A Pareto Chart is a bar chart that ranks problems or causes of problems in descending order from left to right on a horizontal axis. Problem Areas in Setting Up Meeting Rooms 60 (48) 50 Number of Times Problem Occurred 40 30 20 (10) 10 (6) (5) (4) (3) 0 External Noise Room arranged improperly Room not clean Room uncomfort- able Room not set up on time AV needs not met Problem Type Information provided courtesy of Sewickley Valley Hospital, PA OH PC-1
Workshop Objectives PG 3 Is designed to... • Help participants learn how to use a Pareto Chart to increase the effectiveness of problem solving and process improvement. • Help participants prepare for, construct and interpret a Pareto Chart. Is not designed to... • Help participants become skilled in facilitating a group using a Pareto Chart. OH PC-2
Pareto Chart Objectives PG 3 • To work as a team to tackle problems in a systematic way, starting with the most important problem. • To find the 20% of the sources of 80% of the problems in a process or system. • To get closer to the root cause by breaking a problem down into smaller problems and identifying their causes. • To build a clear, easy-to-understand visual to track progress. OH PC-3
Your Role in the Workshop PG 4 • Don’t be afraid to make mistakes; everyone is learning. • Listen to each other as well as to the workshop leader; each person has a lot of valuable experience and insight. • Give the tool a chance to work; don’t judge it before you’ve experienced the whole process. • Feel free to have fun; no one says learning has to be dull! OH PC-4
Time _______________ _______________ _______________ _______________ Topic Workshop Introduction Pareto Chart Introduction Pareto Chart Practice Pareto Chart Follow-up Workshop Agenda PG 4 OH PC-5
® M&M’s Pareto Chart ® • Decide upon categories. • Divide the data into categories. • Construct the bars. • Interpret the chart. OH PC-6
Constructing the Pareto Chart PG 6 Step 1: Choose a Problem to Study Step 2: Choose Categories Step 3: Select a Unit of Measure Step 4: Choose a Time Period Step 5: Gather Data Step 6: Compare Data Step 7: Construct the Chart Step 8: Show Cumulative Percentages (optional) Step 9: Interpret the Results OH PC-7
Steps at a Glance PG 7 OH PC-8
The Facilitator’s Role A facilitator is expected to: • Make sure that the problem is clearly understood by everyone. • Get everyone on the team to participate in the current step. • Manage the time so that each task is finished based on the training schedule. • Make sure that any and all ideas are recorded accurately. • Summarize the team’s conclusions based on the consensus of the team and the specific assignment. OH PC-9
Check Sheet Carmen’s World Famous Whoopie Pies Project: Carl June 20-26 Definition: The Check Sheet is a simple, organized way of tracking the frequency of particular events over time. Data collected by: Dates: T ypes of defects in 200 Location: Heavenly, Maine plant Lot size: finished pies Defect Total June 20 June 21 June 22 June 23 June 24 June 25 June 26 T oo much cream 24 T oo little cream 9 T oo crumbly 21 T oo big 13 T oo small 14 Not sweet 9 enough Not chocolaty 1 enough Has a bite in it 6 OH PC-10
Uses of a Check Sheet • To gather data • To test a theory • To evaluate alternative solutions • To verify that your improvement worked OH PC-11
Constructing a Check Sheet 1. Agree upon definitions. 2. Plan the data collection. 3. Design the Check Sheet. 4. Collect the data. OH PC-12
Steps in Constructing a Pareto Chart • Draw the X and Y axes. • Record the scale on the Y axis (vertical line). • Construct the vertical bars on the X axis (horizontal line). • Combine the smallest bars. • Make it clear. OH PC-13
HOTrep Problem Data 220 200 180 160 140 120 100 80 60 40 20 # of Reported Occurrences 33% Boot problems (68) Reflection hang (24) Lat. Connection (20) System integrity (19) System config. (16) Print problems (16) Reflection syst. integrity (11) File problems (8) Reflections misc. (6) Bad configuration (3) Others (15) 12% 10% 9% 8% 8% 7% 5% 4% 3% 1% HOTrep Problem Data PG 13 Information provided courtesy of SmithKline Beecham OH-PC 14
Pareto Chart Process Questions • Any surprises? • Effect on the team? • Advantages? • Concerns? OH PC-15
After the Pareto Chart PG 15 • Talk things out; decide what it means. • Collect more data if necessary. • Communicate with others. OH PC-16
Is a Tool Needed? PG 16 • Strong support needed? • Requires consensus? • Consensus difficult? OH PC-17
Is the Pareto Chart the Right Tool? PG 16 • Do you need to focus on the problems or causes that will have the biggest impact on improving the process? • Do you need to break some problems down into finer-grain detail? • Do you need an easy visual way to track progress? • Do you need a tool to show that new problems are not cropping up when others get solved? OH PC-18
Reason for Failed Appointments - Source of Data is: Shore Commands PG 17 35 30 25 20 % of failed appointments 15 10 5 0 Forgot Work- load Personal Business Leave Misc. Trans- ferred Vehicle % 31 25 21 8 8 4 2 Information provided courtesy of U.S. Navy, Naval Dental Center, San Diego OH PC-19
Reason for Failed Appointments - Source of Data is: Fleet Commands PG 18 30 25 20 % of failed appointments 15 10 5 0 Corpsman Under- way Forgot Personal Business Vehicle TAD/ Transfer School % 27 25 23 9 7 5 4 Information provided courtesy of U.S. Navy, Naval Dental Center, San Diego OH PC-20
Dollars ($) # of Complaints 10,000 15,000 20,000 5,000 10 15 20 25 0 5 0 Shipping Instal- lation Field Service Customer Complaints and Cost to Rectify Field Service Complaints Instal- lation Clerical Cost to Rectify Field Service Complaints Field Service Customer Complaints Delivery Shipping © 1996 GOAL/QPC Instructional Module–Pareto Chart 42% of all complaints 13% of total cost Clerical Delivery Misc. Misc. PG 19 PG 19 OH PC-21
Keys to Successful Use of the Pareto Chart PG 21 • Use it when there is a lack of focus on which problem or cause to address. • Use it to engage visual learners in the process of moving towards the solution phase of problem solving or process improvement. • Keep everyone on the team involved and contributing to the process. OH PC-22