Measuring Reaction Rates: Experimental Procedures and Influencing Factors
170 likes | 322 Views
This guide provides an overview of suitable experimental procedures for measuring reaction rates. It includes methods such as monitoring gas volume changes, mass differences, light transmission alterations, titration, and conductivity measurements. Each method's advantages and limitations are discussed, as well as factors impacting reaction rates like temperature, concentration, particle size, pressure, and catalysts. Practical techniques such as water displacement and the use of Vernier gas sensors are highlighted. Finally, the significance of maintaining a steady temperature during experiments is emphasized.

Measuring Reaction Rates: Experimental Procedures and Influencing Factors
E N D
Presentation Transcript
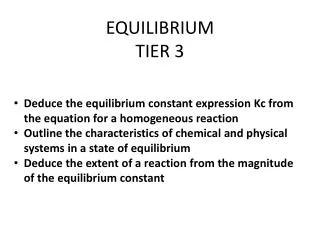
TIER 3 Identify suitable experimental procedures for measuring rates of reactions Identify the factors affecting the rate of a reaction Calculate the rate of a reaction from experimental data Model the collision theory and explain the factors necessary for a reaction to take place BL TIER 3
EXPERIMENTAL PROCEDURES FOR MEASURING RATES OF REACTIONS Change in volume of a gas produced Change in mass Change in transmission of light Change in concentration measured using titration Change in concentration measured using conductivity Non-continuous method of detecting change during a reaction
Change in volume of a gas produced If a gas is one of the products in a reaction, an apparatus used to collect the gas can be used to time the amount of gas produced at various time intervals. One such apparatus that we will use is Vernier’s gas sensors and the Logger Pro software. The gas sensor will collect the gas and send the information to Logger Pro. A graph can then be generated to examine the data. Another method is to collect the gas by water displacement and measure the amount of gas collected in an inverted burette at various time intervals. The water displacement method will only work if the gas has low solubility in water. One way to make this method work better is to use warm water since gases are more soluble in cold water than warm water. The water displacement method is not as accurate as the use of the gas sensors because the gas is often generated as such a fast pace that it is difficult to read the time and burette scale at small enough intervals to get valid data.
Change in mass Another way to measure the rate of a reaction involving a gas as one of the products, is to measure the difference in the mass of the reactants as they are being converted into products. If the gas is allowed to escape, the decrease in mass can be measured at various time intervals and a graph of mass of the reactants against time can be analyzed. This method also has some disadvantages. Since gases generally have low mass especially gases such as hydrogen, a balance sensitive enough to measure low mass must be used. Even if a balance that is capable of measuring the mass of low density gas such as hydrogen is available, air currents in the room and vibrations can greatly effect the reading.
Change in transmission of light A technique using a colorimeter or spectrophotometer is often used if the reaction involves a change or intensity in color. A light is passed through the solution and a photocell records the amount of change in either the transmittance or absorption of the light through the solution against time intervals The amount of transmittance of absorption can be converted to known concentrations using a standard curve based on readings of known concentrations by using Beer’s law.
Change in concentration measured using titration Titration is a procedure used to find the concentration of an unknown substance (analyte) by reacting it with another substance of known concentration (titrant). The most common titrations involve finding the concentration of an acid by using a known concentration of a base or visa versa. Many other types of titrations involving oxidation reduction reactions can be used to determine the concentration of an unknown substance. In order to use titration to measure the change in concentration over a certain time interval, can be a difficult task. Not only do samples need to be extracted at various times, but the reaction must be stopped in the samples as soon as they are extracted. This is called “quenching” the reaction.
Change in concentration measured using conductivity If a reaction involves a change in the concentration of ions, a conductivity sensor can be used to measure the change in conductivity over a certain time interval. As with the colorimeter, the conductivity values can be converted into concentration by first measuring the conductivity of the various ions in the reactions against known concentrations.
Non-continuous method of detecting change during a reaction At times, it may be more convenient to record the start and stop time of a reaction instead of taking measurements over various time intervals. If a reaction involves an observable change that indicates that the reaction has reached an end point, then the non-continuous method is often used. For example, observing the time it takes a solid such as magnesium to disappear when it reacts with an acid is a good example where this method could be used. Another example is to record the time it takes for a solution of sodium thiosulfate reacted with dilute acid to become opaque.
NO MATTER WHICH PROCEDURE IS USED TO DETERMINE THE RATE OF A REACTION , ONE THING THAT MUST BE CONTROLED IS THE TEMPERATURE. IN ORDER TO KEEP THE TEMPERATURE STEADY THROUGHOUT THE REACTION, A THERMOSTATICALLY CONTROLLED WATER BATH CAN BE USE.
Factors affecting the rate of a reaction Temperature Concentration Particle size Pressure Catalyst
Temperature Increasing the temperature increases the rate of all reactions, because the average of the kinetic energy of the particles increases. This means that more particles will have energies exceeding the activation energy Also this will result in more collisions and the more collisions will result with the proper orientation to react. When the temperature increases, the area under the curve does not change because the total number of particles remains constant. More particles have higher velocity, resulting in more kinetic energy and a broader curve. Many reactions double their reaction rate for every 10oC increase in temperature
Concentration Increasing the concentration, increases the rate of a reaction by creating a system that has more particles and thus more collision. The more collisions, the greater the chance of the particles colliding with the proper orientation to react.
Particle Size Decreasing the size of reacting particles increases the surface area allowing more contact and a greater probability of effective collisions. The figure to the left show the reaction of magnesium with hydrogen. Notice how many more collisions can occur when the magnesium is split into lots of smaller bits
Pressure (for gases only) The gas molecules are drawn closer together when the volume decreases. The pressure of gas increases as the volume decreases, since the pressure of a gas is inversely proportional to its volume. This results in an increase in the number of gas molecules per unit volume. The frequency of effective collisions increases and thus increases the rate of reaction.
Catalyst To recap what was discussed in the last video (Kinetics tier 1-2): -speeds up rate of reactions without being used up in the process -most catalyst work by providing an alternate route for the reaction, which lowers the activation energy. -the number of molecules having energy greater than this lowered activation energy increases, and thus the number of effective collisions increases
Calculate the rate of a reaction from experimental data The rate of a reaction is usually expressed as the change in concentration of a species divided by the time during which that change took place. If a graph of concentration against time is plotted, the rate is the gradient of the graph, which is found by drawing a tangent to the curve: The graph above shows the concentration of a chemical reactant against time, and since the concentration of the reactant is falling over time, the gradient of the graph is negative. If the concentration of the product was plotted against time, the gradient would be positive since the concentration increases with time. In the above graph, the change in time on the x axis is 10 min and the change in concentration on the y axis is .4 mol dm-3 Therefore the rate of this reaction is .4/10 = - .04 mol dm-3 min
Model of the collision theory TEMPERATURE INCREASE INCREASE IN THE NUMBER OF PARTICLES WITH KINETIC ENERGY GREATER THAN THE ACTIVATION ENERGY INCREASES THE AVERAGE KINETIC ENERGY OF THE PARTICLES INCREASES THE NUMBER OF COLLISIONS OF THE PARTICLES THE MORE COLLISIONS, THE GREATER THE PROBABILITY THAT THE PARTICLES COLLIDING WILL HAVE THE CORRECT GEOMETRY (ORIENTATION) TO REACT.