Download
1 / 29
290 likes | 483 Views
Automated Control of a Fleet of Slocum Gliders Within an Operational Coastal Observatory. Rutgers University: E.L. Creed, J. Kerfoot, C. Mudgal, S.M. Glenn, O. Schofield Webb Research Corporation: C. Jones, D.C. Webb Dinkum Software: T. Campbell WETLabs, Inc.: M. Twardowski

E N D
Automated Control of a Fleet of Slocum Gliders Within an Operational Coastal Observatory Rutgers University: E.L. Creed, J. Kerfoot, C. Mudgal, S.M. Glenn, O. Schofield Webb Research Corporation: C. Jones, D.C. Webb Dinkum Software: T. Campbell WETLabs, Inc.: M. Twardowski Mote Marine Laboratory: G. Kirkpatrick, J. Hillier
Development of Slocum Gliders Funded By: Office of Naval Research State of New Jersey NOAA EcoHab Program National Science Foundation - Biological
Why Gliders? Until now data collection has been centered around short bursts of intensive sampling covering very small spatial areas Gliders are beginning to provide continuous data collection over long time periods (weeks) with little human intervention making data acquisition: 1) more efficient 2) less expensive 3) more complete spatially and temporally
Goal Develop an intelligent fleet of Slocum Gliders that will provide maps of the physics and bio-optics of coastal waterways Goal divided into three areas: 1) Develop intelligent software to automatically control the Gliders 2) Develop miniaturized physical and bio-optical sensors to integrate into the Gliders 3) Perform both long duration Glider flights and multiple Glider flights
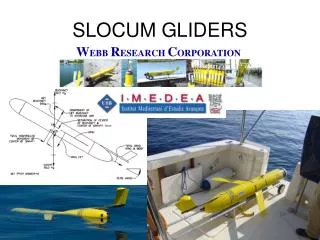
Slocum Electric Glider Length: 1.5 m Weight: 52 kg Hull Diameter: 21.3 cm
Glider Communication Communication between the Glider and the Shore Command Center can be done in three ways: 1) FreeWave modems for local, high speed communication Line of Sight RF (928MHz) 2) Iridium for bi-directional, long distance communications 3) ARGOS as a recovery beacon
Moves in a saw-toothed trajectory Average forward speed of 1 kilometer/hour Depth range 4-200 meters Navigation done using GPS, dead reckoning and the altimeter Average deployment duration is 25 days and 600 km Deployment/recovery from small vessels of opportunity by one or two people Glider Operation Facts
Glider Progress in Last Year • Software • Sensor Integration • Glider Flights
Control Center Software A Mission Control Center is under construction to guide the fleet of Gliders in their data collection Implementation of the Mission Control Center is based on Agent Oriented Programming which is used by NASA in their exploring rovers
Control Center Software Desired Features • Must be a flexible, autonomous and responsive tool • Able to communicate with multiple gliders • simultaneously as well as external data • sources such as CODAR, satellites • 3) Able to process incoming data from all sources and • determine if significant physical or bio- • optical features are present • 4) Able to change current mission if incoming data • indicates a change should be made • 5) Able to notify researchers of the current status • of the mission
Glider Mission Tracking 18-Sep-2003 09:00:03
Glider Progress in Last Year • Software • Sensor Integration • Glider Flights
Science Packages Integrated into Gliders HydroScat 2 Breve Buster SAM (Scattering Attenuation Meter)
HydroScat 2 HS2: measures optical backscatter at 2 wavelengths, Bb676 (red) and Bb470 (blue) measures fluorescence at Bb676
Breve Buster Breve Buster:a hyper-spectral spectrophotometer detects red tideby measuring hyper-spectral absorption
Scattering Attenuation Meter (SAM) SAM BB3 FL-LSS Measures backscatter (bb at 532nm), attenuation (c at 650nm), broadband side scattering (bs) and chlorophyll fluorescence (fl)
Glider Progress in Last Year • Software • Sensor Integration • Glider Flights
Missions Flown This Year WhereDurationData Collected Gulf of Mexico daily (January 13-16, 2003) CTD, HS2 Gulf of Mexico daily (January 13-16, 2003) CTD LEO15 6 hours (May 5, 2003) CTD LEO15 7 hours (May 7, 2003) CTD LEO15 28 hours (May 14-15,2003) CTD LEO15 3 hours (May 20, 2003) CTD, Breve Buster LEO15 52 hours (July 15-17, 2003) CTD Boat Basin (Tuckerton) 47 hours (July 23-25, 2003) CTD, SAM LEO15 360 hours (Aug. 5-20, 2003)CTD CBLAST (Martha’s Vineyard) 70 hours(Aug 18-21, 2003) CTD Buzzard’s Bay 4 hours (Aug 18, 2003) CTD, SAM Buzzard’s Bay 7 hours (Aug 19, 2003) CTD, SAM LEO15 greater than 15 days CTD, HS2 Gulf of Mexico 2 weeks CTD, Breve Buster
Breve Buster Data – May 20, 2003 Breve Buster Data Data collected during the first in-water deployments of the Optical Phytoplankton Discriminator (OPD) at the Rutgers University Field Station, Tuckerton, New Jersey, May 20, 2003. Particulate absorbance spectra collected by the OPD were compared to the standard spectrum of the target species Karenia brevis, the Florida red tide dinoflagellate. Similarity index at or below 0.5 indicate that a very low proportion of the phytoplankton biomass is contributed by the target species. Inset shows the vertical cross-section of the Slocum Glider transect carrying the OPD.
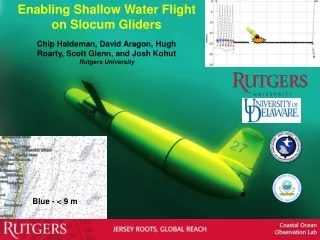
15 Day Deployment at LEO-15 August 5-20, 2003 Distance covered: 413.5km Avg. Speed: 1.15km/hr Communication: FreeWave and Iridium
3 Day Deployment off of Martha’s Vineyard August 18-21, 2003 Distance covered: 21nm Avg. Speed: 0.45km/hr Communication: Iridium
7 hour Buzzard’s Bay Deployment August 19, 2003
Conclusions 1) Gliders provide scientists with continuous and spatially extensive data 2) Data can be automatically downloaded, processed and posted to the web 3) 3 sensors have been successfully miniaturized and integrated into Gliders 4) Multiple Gliders can be flown simultaneously in one area 5) Single Gliders can be flown simultaneously in multiple areas 6) Bi-directional communication with Gliders is successful via both Iridium and R/F modem
Future Plans Software: Continued implementation of the agent software Field Work: Continued long-term Glider deployments are planned for the New York Bight Apex to observe the interaction of the Hudson River plume with the stratified continental shelf waters Breve Buster flights in Gulf of Mexico later this year to study red tides Instrumentation: 1) Miniaturization and installation of upward and downward looking ADCPs