Download
1 / 44
1.6k likes | 6.95k Views
Chromosome Mapping in Eukaryotes. Chapter 5. How can scientists determine where genes are located on the chromosome?. Chapter 5 Chromosome Mapping. 5.1 Genes Linked on the Same Chromosome Segregate Together

E N D
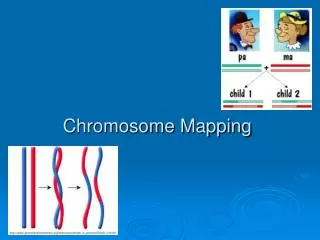
Chromosome Mapping in Eukaryotes Chapter 5
How can scientists determine where genes are located on the chromosome?
Chapter 5 Chromosome Mapping 5.1Genes Linked on the Same Chromosome Segregate Together 5.2 Crossing Over Serves as the Basis of Determining the Distance between Genes during Chromosome Mapping 5.3 Determining the Gene Sequence during Mapping Relies on the Analysis of Multiple Crossovers
Chapter 5 Chromosome Mapping 5.6Drosophila Genes Have Been Extensively Mapped 5.7 Crossing Over Involves a Physical Exchange between Chromatids 5.8Recombination Occurs between Mitotic Chromosomes 5.9 Exchanges Also Occur between Sister Chromatids
Morgan & Drosophila • Thomas Hunt Morgan - first to associate a specific gene with specific chromosome in early 20th century • Drosophila melanogaster, a fruit fly species that eats fungi on fruit • Prolific breeders - generation time of 2 weeks
Linked Genes • Linked genes - genes located on the same chromosome • Tend to be inherited together • Results of crosses with linked genes deviate from those expected according to independent assortment
Morgan & Linkage • Inheritance of characters for body color and wing size in Drosophila • Wild-type body color is gray (b+) and the mutant black (b) • Wild-type wing size is normal (vg+) and mutant vestigial (vg) • Morgan crossed F1 heterozygous females (b+bvg+vg) with homozygous recessive males (bbvgvg)
Should produce 4 phenotypes in a 1:1:1:1 ratio • However, large number of wild-type (gray-normal) and double-mutant (black-vestigial) flies among the offspring • Correspond with those of the parents • Reasoned that body color & wing shape are usu. inherited together b/c their genes are on same chromosome
Other two phenotypes (gray-vestigial and black-normal) were fewer than expected from independent assortment • New phenotypic variations must be the result of crossing over (recombination)
Complete Linkage • Complete linkage - only parental (noncrossover) gametes are produced. • If crossing over between two linked genes occurs between two nonsister chromatids, both parental and recombinant (crossover) gametes are produced
Linkage Groups • Genes on the same chromosome are part of a linkage group. • The number of linkage groups should correspond to the haploid number of chromosomes.
Recombination • Random orientation of homologous chromosomes at metaphase 1 allows for cross over • Linked genes tend to move together through meiosis and fertilization • Under normal Mendelian genetic rules, do not expect linked genes to recombine into assortments of alleles not found in parents
Morgan’s Results • If wing shape & body color genes were linked, we would expect F1 offspring to produce only 2 types of gametes, b+ vg+ and bvg • Results of Morgan’s testcross didn’t conform to either independent assortment or complete linkage • Independent assort: should produce a 1:1:1:1 ratio • Completely linked: should see a 1:1:0:0 ratio (only parental phenotypes)
Most of offspring had parental phenotypes, suggesting linkage • However, 17% of the flies were recombinants, suggesting incomplete linkage
Morgan’s Proposal • Some mechanism occasionally exchanged segments b/t homologous chrom • Switched alleles b/t homologous chrom • Crossing over results in more types of gametes than by Mendelian rules alone
Occasional production of recombinant gametes during prophase I accounts for occurrence of recombinant phenotypes in Morgan’s testcross
The percentage of offspring resulting from recombinant gametes depends on the distance between the two genes on the chromosome.
Review: Recombination • Synapsed chromosomes in meiosis wrap around each other to create chiasmata that are points of genetic exchange.
Rate of Recombination • Two genes located relatively close to each other along a chromosome are less likely to have a chiasma form between them, and it is less likely that crossing over will occur. SO… • Frequency of recombination reflects distance b/t genes • Farther apart 2 genes are, the higher the recombination frequency
Farther apart 2 genes are, higher recombination frequency • We can use the recombination frequency to calculate the RELATIVE distance of 2 genes
Calculating Gene Distances • Interlocus distance - degree of crossing over between any two loci on a single chromosome is proportional to the distance between them
Calculating Gene Distances • One map unit = 1% recombination between two genes on a chromosome. • Map units are often called centimorgans (cM) and are relative distances, not exact ones.
Alfred Sturtevant • Recombination frequencies from Drosophila crosses to map relative position of genes along chromosomes - linkage map • Pupil of T.H. Morgan
Sturtevant’s Findings • Relative position of three fruit fly genes, body color (b), wing size (vg), and eye color (cn) • Recombination frequency b/t cn and b is 9%. • Recombination frequency b/t cn and vg is 9.5%. • Recombination frequency b/t b and vg is 17%. • Only possible arrangement of 3 genes? • Eye color (cn) between the other 2
Recombination frequencies in mapping example not quite additive: 9% (b-cn) + 9.5% (cn-vg) > 17% (b-vg)
Single Crossovers • A single crossover (SCO) alters linkage between two genes ONLY if the crossover occurs between those two genes
Determining the gene sequence during mapping relies on the analysis of multiple crossovers • However, multiple crossovers MAY cancel each other out • reduces observed number of recombinant offspring • Genes father apart more likely to experience multiple crossing over events
Double Crossovers • Double crossovers (DCOs) can be used to determine the order of three linked genes • To study double exchanges, three pairs of genes must be investigated, each heterozygous for two alleles
The expected frequency of double-crossover gametes is much lower than that of either single-crossover gamete class.
As the distance between two genes increases, mapping experiments become more inaccurate • When two genes are close together, the accuracy of mapping is high. As the distance between them increases, the accuracy of mapping decreases.
Chromosome Banding • Chromosome banding techniques allow identification of the exact origin of the crossover • In this way, it is possible to compile gene maps of human chromosomes