Download
1 / 63
700 likes | 1.56k Views
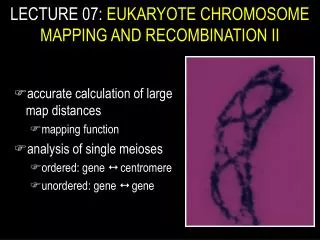
LECTURE 07: EUKARYOTE CHROMOSOME MAPPING AND RECOMBINATION II. accurate calculation of large map distances mapping function analysis of single meioses ordered: gene centromere unordered: gene gene. CHAPTER 4: FURTHER IDEAS.

E N D
LECTURE 07: EUKARYOTE CHROMOSOME MAPPING AND RECOMBINATION II • accurate calculation of large map distances • mapping function • analysis of single meioses • ordered: gene centromere • unordered: gene gene
CHAPTER 4: FURTHER IDEAS • double & higher multiple crossovers underestimates of map distances calculated from recombination • specialized mapping formulae accurate map distance corrected for multiple crossovers • analysis of single meioses (in Fungi) can... • position centromeres on genetic maps (~ genes) • mechanisms of segregation and recombination • crossovers occur occasionally in mitotic diploid cells
ACCURATE MAPPING • mapping large distances is less accurate • best estimate of map distance obtained by adding distances calculated for shorter intervals • if possible, include more genes in the map
ACCURATE MAPPING • problems occur when you have ... • no intervening genes • genes very close together
ACCURATE MAPPING • account for multiple crossovers ? • need mapping function to correct for multiple events and accurately relate recombination to map distance
POISSON DISTRIBUTION • low #s sampled from large population • possible numbers obtainable are large, but most samples are small • e.g. random distribution of 100 x 1$ in class of 100 students... few students receive many bills...
POISSON DISTRIBUTION • e.g. random distribution of 100 x 1$ in class of 100 students
POISSON DISTRIBUTION • here, average is 1 bill/student... m = 1 • # for a particular class... i = 0, 1, 2... 100
POISSON DISTRIBUTION • here, mean is 1 bill/student... m = 1 because 100 bills & 100 students • # for a particular class... i = 0, 1, 2... 100 • how many students are predicted to capture 3 bills?
POISSON DISTRIBUTION • here, mean is 1 bill/student... m = 1 because 100 bills & 100 students • # for a particular class... i = 0, 1, 2... 100 • how many students are predicted to capture 3 bills? f(i) = ———— e-m mi i !
POISSON DISTRIBUTION f(0) = 0.368 f(1) = 0.368 f(2) = 0.184 f(3) = 0.061 f(4) = 0.015 f(5) = . . .
POISSON DISTRIBUTION • proportion of class with i items • different m values
MAPPING FUNCTION • use Poisson to describe distribution of crossovers along chromosome • if... • crossovers are random, • we know mean # / region on chromosome • then we can calculate distribution of meioses with 0, 1, 2... n multiple crossovers
MAPPING FUNCTION • recombination frequency (RF) = % recombinants • meiosis with 0 crossovers RF of 0% • meiosis with 1 crossover RF of 50%
MAPPING FUNCTION • meioses with 0 crossovers RF of 0% • meioses with > 0 crossovers RF of 50% compare the non-recombinant chromatids recombinants shown darker
MAPPING FUNCTION • recombinants make up half of the products of meioses with 1 or more crossovers • 0 crossover class is the only critical one • proportion of meioses with at least one crossover is 1 – 0 class; the 0 class is... f(0) = ———— = e-m e-m m0 0 !
MAPPING FUNCTION • proportion of meioses with at least one crossover is 1 – 0 class, which is... f(0) = ———— = e-m • so the mapping function can be stated as... RF = ½ (1 – e-m) e-m m0 0 !
~40 MAPPING FUNCTION RF = ½ (1 – e-m) • for low m... m = 0.05, RF = ½ m m = 0.1, RF = ½ m m = 1, RF = 50 ... RF = m / 2 at the dashed line or use the equation...
MAPPING FUNCTION RF = ½ (1 – e-m) • RF = 27.5 cM ? 0.275 = ½ (1 – e-m) 0.55 = 1 – e-m e-m = 1 – 0.55 = 0.45 m 0.8 (mean # of crossovers / meiosis) corrected RF = m/2 = 0.4 = 40 % or 40 cM
~40 MAPPING FUNCTION RF = ½ (1 – e-m) = 40 cM • for low m... m = 0.05, RF = ½ m m = 0.1, RF = ½ m m = 1, RF = 50 ... RF = m / 2 at the dashed line or use the equation...
MAPPING FUNCTION • mapping large distances is less accurate • best estimate of map distance obtained by adding distances calculated for shorter intervals • if possible, include more genes in the map • put RF values through a mapping function
ANALYSIS OF SINGLE MEIOSES • products of meiosis remain together • groups of haploid cells... either 4 (tetrads) or 8 (octads)
ANALYSIS OF SINGLE MEIOSES • Neurospora crassa (we use Sordaria fimicola in Lab 5) • note pigment phenotypes of the ascospores
ANALYSIS OF SINGLE MEIOSES • meiosis & post-meiotic mitosis in linear tetrad / octad
ANALYSIS OF SINGLE MEIOSES • 2 kinds of mapping with tetrads / octads: • ordered analysis to map gene centromere • unordered analysis to map gene gene
A & asegregate to different poles ORDERED ANALYSIS • no crossing over between gene A and centromere “MI” segregation
A & asegregate to different poles ORDERED ANALYSIS • crossing over between gene A and centromere “MII” segregation
ORDERED ANALYSIS • 4 types of MII patterns • equal frequencies
MI ORDERED ANALYSIS
MI ORDERED ANALYSIS # MI = 126 + 132 = 258 = 86 % # MII = 9 + 11 + 10 + 12 = 42 = 14 %
ORDERED ANALYSIS divide by 2
MI ORDERED ANALYSIS # MII = 9 + 11 + 10 + 12 = 42 = 14 % A centromere = 14 / 2 = 7 cM
a b ...independent a b ...independent a b ...??? ORDERED ANALYSIS • now consider 2 genes... • 3 possibilities: 1. the genes are on separate chromosomes 2. the genes are linked but on opposite sides of the centromere 3. the genes are linked and on the same side of the centromere
ORDERED ANALYSIS • crossover between centromere and both genes...
ANALYSIS OF SINGLE MEIOSES • 2 kinds of mapping with tetrads / octads: • ordered analysis to map gene centromere • unordered analysis to map gene gene
ORDERED ANALYSIS • lots of crossovers between gene & centromere... appear to be unlinked
ORDERED ANALYSIS • MII frequency never reaches 100% • theoretical maximum RF = 2/3 or 66.7% • theoretical maximum calculated map distance = 33.3% • >1 crossovers with distance... • especially, DCO look like SCO
ORDERED ANALYSIS • second allele determines pattern • maximum MII = 2/3 = 33.3 % = 33.3 cM • multiple crossovers !
UNORDERED ANALYSIS • meioses with 0 crossovers RF of 0% • meioses with > 0 crossovers RF of 50%
UNORDERED ANALYSIS = NCO + 1/4 DCO = 1/4 DCO = SCO + 1/2 DCO • parental ditypes • non-parenal ditypes • tetratypes
UNORDERED ANALYSIS • NCO = PD – NPD PD but not NCO = P score 1x
UNORDERED ANALYSIS • SCO = TT – 2NPD T but not SCO = 2P score 2x
UNORDERED ANALYSIS • DCO = 4NPD DCO but not NPD = 4P score 4x
UNORDERED ANALYSIS • corrected map distance (cM) between genes = RF × 100 cM = [ ½ single events + double events ] / total × 100 cM = [ ½ ( TT – 2NPD ) + 4NPD ] / total × 100 cM = ½ [ TT + 6NPD ] / total × 100 cM
ANALYSIS OF SINGLE MEIOSES • 2 kinds of mapping with tetrads / octads: • ordered analysis to map gene centromere • unordered analysis to map gene gene