Download
1 / 46
460 likes | 592 Views
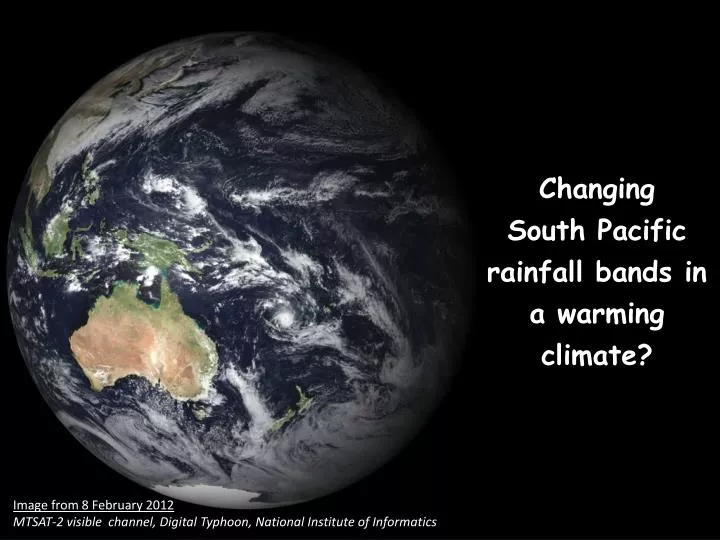
Changing South Pacific rainfall bands in a warming climate?. Image from 8 February 2012 MTSAT-2 visible channel, Digital Typhoon, National Institute of Informatics. Spotlight on the South Pacific Convergence Zone:. How will Pacific rainfall bands respond to a warming climate?.

E N D
Changing South Pacific rainfall bands in a warming climate? Image from 8 February 2012 MTSAT-2 visible channel, Digital Typhoon, National Institute of Informatics
Spotlight on the South Pacific Convergence Zone: How will Pacific rainfall bands respond to a warming climate? Collaborators: Shayne McGregor1, Matthew H. England1, Matthieu Lengaigne2, and Wenju Cai3 University of Hawaii colleagues: Axel Timmermann, Niklas Schneider, and Karl Stein 1Climate Change Research Centre, University of New South Wales 2LOCEAN, France 3CSIRO Marine and Atmospheric Research, Australia Matthew J. Widlansky International Pacific Research Center
Southern Hemisphere Convergence Zones Austral summer (DJF) climatology of satellite observed rainfall (GPCPv2.1) South Indian Convergence Zone (SICZ) South Pacific Convergence Zone (SPCZ) South Atlantic Convergence Zone (SACZ) 5 mm day-1 contour indicated by blue line SPCZ is the largest rainband in the Southern Hemisphere and provides most of the rainfall for South Pacific island nations
Historical perspective: Very early ship observation “I was struck by the precise similarity of the clouds, sky, peculiarities of wind, and weather, to what we had been accustomed to meet with off the coast of Patagonia: and I may here remark that, throughout the southern hemisphere, the weather, and the turn or succession of winds, as well as their nature and prognostications, are remarkably uniform.” Captain Fitz-Roy, Narrative of the surveying voyages of His Majesty’s Ships Adventure and Beagle between the years 1826 and 1836
Historical perspective: Early satellite observations Cloud Cover Percentage (DJF) S. Pacific ~30% Quasi-stationary Southern Hemisphere cloud band locations are “related closely to that of the long-wave hemispheric pattern.” S. Atlantic ~30% S. Indian ~20% Satellite cloud brightness 1968-1971 composite of 5 day averages (Streten 1973, Mon. Wea. Rev.)
Historical perspective: Literature review • SPCZ is a region of widespread cloud cover and rainfall extending southeastward from New Guinea into Southern Hemisphere mid-latitudes. (Streten 1973; Trenberth 1976) • Tropical convection is oriented zonally and collocated with warmest SST. (Vincent 1994) • Baroclinic-type disturbances influence the diagonal region. (Kiladis et al. 1989) • Orientation changes during different phases of the El Niño-Southern Oscillation (ENSO). (Trenberth1976; Streten and Zillman 1984; Karoly and Vincent 1999; Folland et al. 2002) SPCZ SPCZ SICZ SACZ Why does the SPCZ extend diagonally away from the equator in the Southern Hemisphere?
Outline • Historical perspective • Snapshot of SPCZ science, circa 2010 • Recent advancements in understanding: • Why is there a diagonal rainband? • How will the rainband respond to climate change? • Will frequency of future extreme SPCZ events change? Answers to these questions are based on the underlying sea surface temperature (SST) distribution and its projected change
August 2010: State of the science Workshop on the SPCZ Apia, Samoa (Aug. 2010) Secretariat of the Pacific Regional Environment Programme The Pacific climate change Science Program Hypothesis for dynamics of the SPCZ SPCZ related extreme events on interannual timescales such as droughts, floods, and tropical cyclones Projections of the SPCZ response to climate change Meeting topics
1) Dynamics of the SPCZ Observed rainfall and SST climatology during DJF (mm day-1) 26°C 28°C ~ GPCP rainfall ~ NOAA SST • Tropical SPCZ adjacent the meridional SST gradient (equatorial) • Subtropical SPCZ transects the meridional SST gradient (mid-latitudes) and is west of maximum zonal SST gradient (e.g., Lindzen and Nigam 1987) (2011, Clim. Dynam.)
2) Interannual variability of the SPCZ Observed rainfall and SST climatology during DJF (mm day-1) Extreme El Niño 26°C 28°C El Niño La Niña ~ GPCP rainfall ~ NOAA SST Neutral (mean) Extreme El Niño (anomaly) Tropical Cyclone Genesis Adapted from Figure 12 (Vincent et al. 2011, Clim. Dynam.)
3) Uncertain rainfall projection in IPCC AR4 DJF (2080 to 2099) % • IPCC Fourth Assessment Report • “Regional Climate Projections- • Small Islands”: • 1) Rainfall is likely to increase along equator and decrease in the Southeast Pacific (where it is already dry) • 2) Multi-model mean trend is small in the SPCZ and inter-model uncertaintyis large • 3) Impact of coupled model biases on future rainfall projections not addressed Rainfall projection (%) CMIP3 (A1B, 21 models) Number of models > 0 Adapted from Figure 11.25 (IPCC AR4, Chapter 11)
Fundamental questions unanswered in Samoa Why is there a diagonal rainband in the Southern Hemisphere, but not in the Northern Hemisphere? Why is the tropical Pacific rainfall response to greenhouse warming so uncertain? How will extreme events, such as strong El Niño occurrences and zonally oriented SPCZ events, respond to climate change? Today, I will present three papers (2012) addressing each question individually
Question #1 Why is there a diagonal rainband in the Southern Hemisphere, but not in the Northern Hemisphere? Why is the tropical Pacific rainfall response to greenhouse warming so uncertain? How will extreme events, such as strong El Niño occurrences and zonally oriented SPCZ events, respond to climate change? (Q. J. Roy. Meteor. Soc., 2012)
Influence of SST forcing on basic-state SST Climatology 240 W m-2 OLR (rainfall proxy) climatology indicated by blue line SPCZ (A) is west of the maximum zonal gradient (B-C) The background quasi-stationary 200 hPa flow is partially dictated by the SST distribution (e.g., Gill 1980)
Upper-troposphere zonal flow 200 hPaZonal Winds & Negative Zonal Stretching Deformation 200 hPaZonal Winds A decelerating jet stream creates a band of upper-troposphericnegative zonal stretching deformation(s-1, 200 hPa)near the subtropical SPCZ: Distribution of mean zonal winds acts to refract Rossby waves (e.g., Hoskins and Ambrizzi 1993, J. Atmos. Sci.)
SPCZ acts as a synoptic ‘graveyard’ From Matthews (2012, Q. J. Roy. Meteor. Soc.): “The propagation of Rossby wavesin a spatially varying mean flow can also be interpreted in terms of accumulation of wave energy(Webster and Holton, 1982). In particular, in jet-exit regions where the mean westerly wind u decreases eastward (∂u/∂x < 0), the zonal wavenumber will increase along a ray path. This leads to a decrease in the wave group speed and an increase in the wave energy density (Webster and Chang, 1998). When applied in the region of the SPCZ (Widlansky et al., 2011), this can explain the observation that the SPCZ acts as a synoptic ‘graveyard’ (Trenberth, 1976).” TRANSIENT WAVES ∂U/∂x < 0
Modes of SPCZ variability ‘Shifted SPCZ’mode 1 (12%) Observed rainfall and 200 hPa zonal wind (DJF) ~ TRMM rainfall ~ NCEP Reanalysis U • SPCZ position and intensity varies on multiple timescales: • Synoptic, Rossby waves • Intraseasonal, MJO • Interannual, ENSO Later, we will look at mode 2 (e.g., Widlansky et al. 2011, Clim. Dynam.) Adapted from Figures 1 and 3 (Matthews 2012, Q. J. Roy. Meteor. Soc.)
Synoptic disturbances from higher latitudes ‘Shifted SPCZ’ (mode 1) composite: OLR (rainfall proxy) and 200 hPavorticity anomalies Path of wave propagation Mean diagonal SPCZ is the sum of equatorward propagating synoptic waves from the subtropical jet towards the equatorial westerly wind duct Adapted from Figure 5 (Matthews 2012, Q. J. Roy. Meteor. Soc.)
Change in basic-state during ENSO La Niña minus El Niño: SST anomaly (shading) UEl Niño = 0 ULa Niña = 0 Path of wave propagation Westerly wind duct constricts during El Niño, hence synoptic waves refract equatorward further east, shifting the diagonal SPCZ northeastward Adapted from Figure 11 (Matthews 2012, Q. J. Roy. Meteor. Soc.)
Why no diagonal rainband in North Pacific? (Q. J. Roy. Meteor. Soc., 2012) A diagonal rainband is the default, triggered by equatorward refraction of synoptic waves, but in the North Pacific: Subtropical jet is strongand narrow (topography) Equatorial westerly wind duct is absent during Northern Hemisphere summer (weaker Walker circulation) NH warm pool is confined near equator during winter SPCZ orientation determined by warm pool configuration and its projected change
Question #2 Why is there a diagonal rainband in the Southern Hemisphere, but not in the Northern Hemisphere? Why is the tropical Pacific rainfall response to greenhouse warming so uncertain? How will extreme events, such as strong El Niño occurrences and zonally oriented SPCZ events, respond to climate change? (2012, in press)
Uncertainty remains in CMIP5 Rainfall trend (RCP 4.5, 21 models) Regional rainfall trend Rainfall change (% Control) 21st century projection (shading) 20th century control (black lines) Inter-model standard deviation Equatorial islands SPCZ islands Inter-model standard deviation Inter-model uncertainty is larger than ensemble mean projected rainfall trend Blue lines enclose simulated 20th century rainfall > 5 mm day-1
Model bias and projected rainfall change Rainfall projection (% 20th century control) scaled by warming at equator, K-1 Shifted South Pacific rainfall bands in a warming climate? r2 = 0.27 (n = 74) Tropical SPCZ (10°S-20°S, 150°E-150°W) RainfallOBS >5 mm day-1 Rainfall bias (% observed climatology)
Procedure: Uncertain rainfall projection? SST gradients influence the observed location and strength of the SPCZ Coupled GCMs yield uncertain 21st century rainfall projections, especially in Southwest Pacific Removing SST bias improves simulated diagonal rainband Bias-corrected climate experiments suggest future drying as regional SST gradients weaken Net rainfall change depends on balance of two mechanisms (of opposite sign) Goal is to explain inter-model uncertainty
Removing SST bias improves climatology SST bias (CMIP5, 20 models) Equatorial Pacific is too cold and Southeast Pacific is too warm • Double-ITCZ bias partly related to SST biases (e.g., Wittenberg et al. 2006, J. Clim.) • Atmosphere GCMs (observed SST) simulate a more diagonal SPCZ Warm Pool AMIP rainfall is too heavy Rainfall climatology (CMIP5, 21 models) Rainfall climatology (AMIP, 5 models) Rainfall bias (CMIP5, 21 models) Rainfall bias (AMIP, 5 models)
Robust SST warming pattern SST trend (tropical mean removed) Maximum equatorial warming is a robust response to greenhouse warming (e.g., Xieet al. 2010, J. Clim.) 21st century projection (RCP 4.5 W m-2, 20 models) Inter-model standard deviation Green lines enclose simulated 20th century Warm Pool (27.5 °C)
Biased SST climatology does not affect SST projection Warm Pool (27.5°C), climatology Shading, warming trend Coupled GCM (CCSM3) response to 2xCO2 No flux correction Radiative flux correction Removing SST bias does not change the warming pattern and improves rainfall climatology Each experiment projects more rain along equator and drying in the South Pacific, but drying in SST bias-corrected experiment occurs in Southwest Pacific collocated with observed SPCZ CO2 increased 10% per year to 710 ppm Projections from last 20 years of 90 year simulations
Bias-corrected island rainfall projections Coupled GCM (CCSM3) response to 2xCO2 Equatorial islands SPCZ islands Equatorial islands SPCZ islands CCSM3 experiment with no flux correction shows no consistent rainfall projection for the SPCZ islands SST bias-correction experiment projects drying for SPCZ islands (typically 5-10%)and more rain along some parts of the equator
Rainfall response to changing SST gradients 21st century trend (tropical mean removed) 2 and ½ Layer Atmospheric Model CMIP3 A1B scenario Tropical Channel Run Idealized Atmospheric GCM (ICTP) Green lines enclose observed Warm Pool (27.5°C) and the changing threshold for deep convection (dashed) (Graham and Barnett 1987, Science; Johnson and Xie2010, Nature Geosci.) Increasing model complexity • SST bias-corrected experiments have a more realistic SPCZ climatology than coupled GCMs. • In response to 21st century SST gradient pattern, rainfall increases where SST warms the most and decreases elsewhere. • SPCZ drying is a robust response regardless of model resolution or convection parameters. Full Atmospheric GCM (CAM3) 21st century projection (shading) 20th century control (blue & black lines)
Rainfall response to tropical mean SST increase = Rainfall response (Total SST trend) Rainfall response (SST gradient pattern) Warmest regions tend to get wetter (Ma et al. 2012, J. Clim.) + Rainfall response (Uniform SST warming, 2.2°C) ? Wet regions tend to get wetter (Held and Soden 2006, J. Clim.)
“Wet gets wetter” Thermodynamic mechanism Rainfall response to tropical mean SST increase (2.2°C): Mean specific humidity increases over entire tropical Pacific supporting an enhanced hydrological cycle. (Held and Soden 2006, J. Clim. andSeager et al. 2010, J. Clim.) Contours depict projected moisture increase (lower troposphere)as simulated by AGCM forced with 21st century SST trend (A1B)
“Warmest gets wetter” Dynamic mechanism Rainfall and wind response to prescribed SST gradient: • Anomalous divergence of moisture away from minor warming regions, such as SPCZ. • Moisture convergence towards warmest waters accounts for increased rainfall at equator. (Ma et al. 2012, J. Clim.) Red contours depict warming more than tropical mean 21st century multi-model trend (CMIP3 A1B emissions)
Delicate balance of opposing rainfall mechanisms Warmest gets wetter Wet gets wetter Wet gets wetter Warmest gets wetter ~2 x CO2 scenario 4 x CO2 scenario How does this balance change for more extreme greenhouse-warming? Rainfall response to tropical mean SST increase for 4 x CO2 (4.4°C): AMIP-future ensemble (4 x CO2 SST) projects rainfall increase for parts of SPCZ For 4 x CO2 conditions, wet gets wetter mechanism almost completely offsets SPCZ drying associated with diminished SST gradient between SPCZ and Equator
Moisture convergence in the SPCZ SPCZ rainfall response to greenhouse warming influenced by two opposing mechanisms: 1) Increasing moisture convergence in lower troposphere (Thermodynamic mechanism) 2) Divergence of moisture away from the rainband towards equatorial regions of greater warming (Dynamic mechanism) % 20th century observations Moisture convergence (g kg-1 s-1) in the SPCZ 76 experiments Robust response Large inter-model spread Net drying Net moisture increase Projected SST trend (°C) in the SPCZ
Answers: Uncertain rainfall projection? SST gradients influence the observed location and strength of the SPCZ Coupled GCMs yield uncertain 21st century rainfall projections, especially in Southwest Pacific Removing SST bias improves simulated diagonal rainband, but rainfall intensity is prone to errors According to bias-corrected experiments, summer rainfall may decrease by 10-20%for some South Pacific islands, assuming moderate warming Net rainfall change depends on delicate balance of opposing thermodynamic and dynamic mechanisms Multi-model scatter of net moisture convergence helps explain inter-model variance in CMIP5 rainfall projections
Question #3 Why is there a diagonal rainband in the Southern Hemisphere, but not in the Northern Hemisphere? Why is the tropical Pacific rainfall response to greenhouse warming so uncertain? How will extreme events, such as strong El Niño occurrences and zonally oriented SPCZ events, respond to climate change? (Nature, 2012)
Defining a “zonal SPCZ event” : PC1 > 1 and PC2 > 0 GPCP rainfall La Niña Zonal SPCZ Neutral Moderate El Niño
Nonlinear behavior of 2nd principal component PC2 PC1 1997/98 El Niño 1997/98 El Niño
CMIP5 experiments Considering only models able to simulate the nonlinear behavior of the SPCZ (12 out of 20 models) RCP 8.5 W m-2 20th century 21st century 201zonal SPCZ events 95zonal SPCZ events
Correcting SST errors Flux adjusted perturbed physics experiments with HadCM3 CGCM (12 out of 17 experiments considered) 20th century 21st century CO2 increased 1% per year 179zonal SPCZ events 57zonal SPCZ events
Meridional SST gradient & zonal SPCZ events Observed rainfall and SST climatology during DJF (mm day-1) Box 1 26°C 28°C Box 2 ~ GPCP rainfall ~ NOAA SST 1997/98 El Niño = [Box 1 SST – Box 2 SST]
Smaller future meridional SST gradient SST trend (departure from tropical mean) Box 1 Box 2 21st century projection (RCP 4.5 W m-2, 20 models) Maximum equatorial warming is a robust response to greenhouse warming (e.g., Xieet al. 2010, J. Clim.)
Increased number of zonal SPCZ events Flux adjusted perturbed physics experiments with HadCM3 model (12 out of 17 experiments considered) 2 1 Greenhouse warming is likely to cause: More summers with small meridional SST gradients 2) Increased frequency of zonal SPCZ events Pacific island communities experience extreme weather–droughts, floods, & tropical cyclones– during zonal SPCZ events
Extreme zonally oriented SPCZ event: 4 January 1998 GMS-5 IR water vapor 6.70-7.16 μm Increased frequency of extreme events is consistent with projected SST warming pattern Ron (Tonga: 67% damaged) Susan (125 kts) Katrina (28 days) Thank you