Download
1 / 24
240 likes | 391 Views
Nimbus BUV and TOMS Data Substantiate the Atmospheric Ozone Depletion Concerns. Arlin Krueger Joint Center for Earth Systems Technology University of Maryland, Baltimore County. Nimbus BUV and TOMS Data Substantiate the Atmospheric Ozone Depletion Concerns. By

E N D
Nimbus BUV and TOMS Data Substantiate the Atmospheric Ozone Depletion Concerns Arlin Krueger Joint Center for Earth Systems Technology University of Maryland, Baltimore County
Nimbus BUV and TOMS Data Substantiate the Atmospheric Ozone Depletion Concerns • By • S Ahmad, Z Ahmad, P Anderson, E Beach, D. Becker, A Belmont, PK Bhartia, L Bowlin, R Browning, D. Burchfield, W. Byerly, E Canevari, B Cano, S Carn, R Casey, G Chalef, S Chandra, P Collins, M Comberiate, C Cote, S Cox, D Cunold, JV Dave, C Davis, M Deland, S Doiron, J. Dowser, J Elliot, R Farquhar, A.J. Fleig, D. Flittner, L Flynn, M Foreman, J Frederick, J Gatlin, P Ginoux, J Gleason, C Gordon, D Gordon, A.E. Green, X Gu, B Guenther, S. Guenther, R. Hering, D Harrison, U Hartmann, DF Heath, BD Henderson, B Herman, J Herman, R. Hertel, C Hestor, M Hinman, R Hudson, J Hurley, R Ignasiak, W.L. Imhof, G Jaross, T Jennings, A Kaveeshwar, K Klenk, R. Kobiachi, G. Kobiachi, M. Kobiachi, N Koep-Baker, N Krotkov, *A Krueger, G Labow, D Larko, K Lee, J Leithch, J Leithch, J Lienesch, B Lowry, CL Mateer, C McKenzie, R McPeters, D. Merrill, T Miles, A J Miller, P. Mitzen, B Monosmith, G. Montwell, R Nagatoni, P Newman, W Nickum, A Oakes, R Ormsby, N Oslik, B Palmer, H Park, V Pavanasaisam, S Plageman, N. Preketes, H Press, J Purcell, B Raines, S Ray, H Reed, S Reed, H Reid, HB Roeder, M. Ruecker, E Rutkowski, R Salikov, S Schaefer, B Schlesinger, J Schneider, C Schnetzler, M Schoeberl, D Schuster, C Seftor, M Shapiro, R Shapiro, R Sipes, J Sisala, P Smith, I Sprod, R Stevenson, J Stokes, R Stolarski, T Swissler, S Taylor, O Torres, S Truong, K Venkatakrishna, L Walters, S Weiland, R White, C Wong, J Ziemke • * speaker
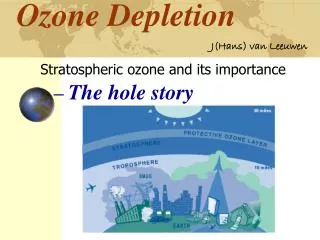
What did we know about ozone before Nimbus BUV and TOMS? • Theory: Chapman proposed photochemistry of oxygen could explain ozone. • Observations: • Total ozone - Dobson measured latitude and seasonal variations; suspected meteorology produced variability. • Vertical ozone distribution - balloons showed effects of weather; rockets supported photochemical model. • Laboratory: Chemists said nitrogen radicals could destroy ozone in catalytic cycle. • Chemical rate coefficients too poorly known to decide if nitrogen cycle worked in the atmosphere. • Halogens were even better catalysts than nitrogen or hydrogen.
Backscatter UV Origins1970: The Nimbus-4 BUV • Ozone profile • First satellite experiments had measured ozone profile • Instrument calibration established from coincident rocket soundings • Total ozone • Sparse Dobson spectrophotometer network • Inter-instrument calibration errors large • CP Cuddapah used Nimbus 3 IRIS data for first total ozone from space • BUV Instrument • NCAR proposal (1965) Dave and Mateer • Instrument: • Goddard Space Flight Center: Heath (Tech. Officer - Krueger) • Beckman Instruments Henderson, Roeder, Meloy, Reid • Solar diffuser plate for calibration • Optimized wavelengths • Total ozone sounding method G.P. Anderson, et al., Proceedings, Symposium sur l’Ozone Atmospherique, 1-7 Sept. 1968, Monaoco, pp239-243. A.J. Krueger, Proceedings, Symposium sur l’Ozone Atmospherique, 1-7 Sept. 1968, Monaoco, pp225-229.
BUV data confirmed catalytic cycle in ozone chemistry • August 1972 solar proton event. • High energy protons produce nitric oxide in upper stratosphere. • Paul Crutzen predicted decrease of ozone. • BUV data show 20% decrease. • Ozone depletion in auroral oval proved catalytic cycle was controlling ozone. • Opened the possibility of catalytic loss of ozone by halogens. Ozone above 4 mb (37 km) vs day number Heath, Krueger & Crutzen, Science, 1977
Total ozone from space:Dave and Mateer Forward model: Dave’s UV multiple-scattering radiative transfer model Inverse model: Mateer
Coverage: Daily global survey Avoid missed event issues by observing: every location every day Ground resolution: Limited by 1970’s data rate, data storage Resolve jet streams Identify local ozone perturbations Heritage: Use BUV monochromator Use BUV total ozone wavelengths Share SBUV diffuser plate for common calibration Concept - GSFC proposal (1972) Krueger Merge with SBUV Heath Instrument - Beckman/ Perkin Elmer/Orbital Sciences Roeder, Lu, Macenka Algorithm - STX Mateer, Kaveeshwar, Bhartia Total ozone mapping origins1978: The Nimbus-7 TOMS
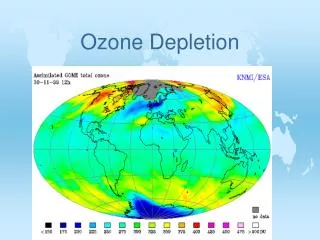
Global total ozone maps • TOMS Missions • Nimbus-7: 11/1/ 1978 - 5/6/1993 • Meteor 3: 8/22/1991 - 11/24/1994 • ADEOS: 8/17/1996 - 6/28/1997 • Earth Probe: 7/15/1996 - present
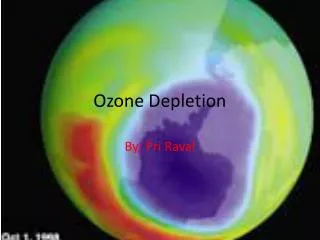
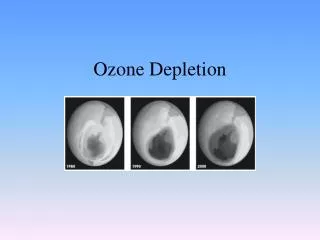
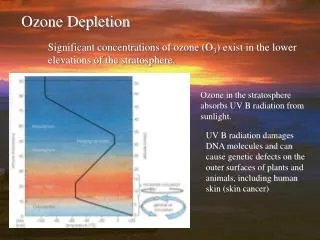
Polar ozone depletion • Environmental concerns overwhelmed meteorological research. • British Antarctic Survey (Farman, et al.,1985) pointed out steep decline in 25-year ozone record over Halley Bay Dobson station; attributed it to chlorine from CFC’s. • TOMS found large ozone loss in Antarctic-size hole (Bhartia et al, 1986; Stolarski, et al., 1986). Dynamic vs chemical cause disputed. • In-situ data from NASA DC-8 and ER2 aircraft found enhanced ClO from heterogeneous reactions of ClONO2 and HCl on polar stratospheric clouds. • Similar ozone losses found in Arctic.
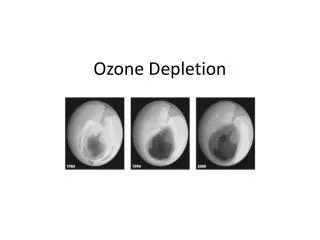
The Antarctic Ozone Hole R. McPeters and Scientific Visualization Studio
Polar ozone depletionAntarctic ozone hole and the Montreal Protocol • Images of rapid springtime ozone loss over Antarctica each year lent credibility to environmental concerns • Progressive annual deepening produced urgency Newman, Stolarski, Schoeberl, Krueger….
Antarctic Ozone Hole Depth and Area of Ozone Hole measured daily http://toms.gsfc.nasa.gov/
Global Ozone TrendsOzone depletion and the SBUV/TOMS calibrations • Nimbus-7 TOMS shared SBUV diffuser plate • Diffuser reflectance and BRDF change with solar exposure • Model-based relative calibrations developed (Pair justification, spectral discrimination) • New TOMS instruments used triple diffuser carousel with different exposure times to infer degradation GSFC: McPeters, Hollandsworth-Frith, Herman, Stolarski, Jaross, Seftor
Impact of BUV & TOMS • Catalytic ozone destruction accepted by scientific community (1977). • Ozone hole images and ozone trends convince public of danger of CFC’s (1986). • Montreal Protocol on Substances that Deplete the Ozone Layer signed (1987). • Nobel Prize in chemistry awarded to Crutzen, Rowland, and Molina (1995). • CFC production phased out.
TOMS data products Total ozone Ground/cloud reflectivity Total sulfur dioxide Aerosols optical depth effective radius or single scattering albedo Tropospheric ozone UVB fluxes Applications: Air chemistry Volcanology Eruption processes Aviation hazards Climate change dust, smoke volcanic ash & sulfate Weather forecasting Model initialization Upper air winds Biosphere Surface UV radiation Air quality Beyondtotal ozone…..
Tracking volcanic sulfur dioxide clouds Rapid drift of volcanic clouds: Difficult air traffic problem Difficult validation problem Krueger, Walters, Schnetzler, Bluth, Carn, Schaefer, Doiron, Sprod
25 years of SO2 mass from volcanic eruptions Carn, et al., Volcanic eruption detection by the TOMS instruments, Geol. Soc. Special Publ., 213, 177-202, 2004
Aerosols change the wavelength dependence of scattered light Compare observed and model Rayleigh spectra to get aerosol signal Low UV reflectivity of soil and water makes detection easy over land and ocean Absorbing aerosols Smoke, mineral dust, and volcanic ash Herman, Torres, Bhartia, Krotkov, Prospero
Residual between TOMS total ozone and MLS stratospheric column High Atlantic values due to biomass burning, lightning, and Walker circulation Tropospheric column ozone Fishman, Chandra, Ziemke …
Conclusions • BUV and TOMS surpassed all expectations • Long life missions due to excellent engineering by Beckman Instruments and dedication of GSFC satellite operations teams • Algorithm development, instrument calibration, and data processing successful due to GSFC Ozone Processing Team • Broad use of data due to high quality daily global census, yet compact datasets • Impacts on geosciences and environmental controls are far reaching
Ozone Theory • Sydney Chapman proposed oxygen photochemistry driven by solar UV. • O2 + hn --> O + O (1) • O + O2 + M --> O3 + M (2) • O3 + hn --> O + O2 (3) • O3 + O --> 2 O2 (4) • Chemists knew that nitrogen and hydrogen radicals could catalytically destroy ozone in the lab. For example, NO can destroy ozone: • NO + O3 --> NO2 + O2 • NO2 + O --> NO + O2 • Other radicals are H, OH, Cl, or Br.