Wind Power
60 likes | 317 Views
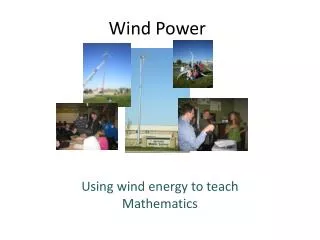
Wind Power. Using wind energy to teach Mathematics. Resources Video to get them interested http://www.thefutureschannel.com/dockets/science_technology/wind_farming/. Middle School friendly Kid Wind Project Wind Power Curves http://www.kidwind.org/PDFs/LESSON_windpowercurves.pdf.

Wind Power
E N D
Presentation Transcript
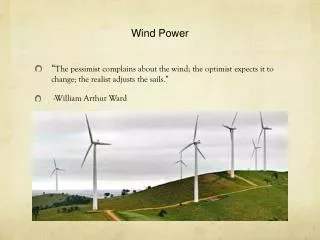
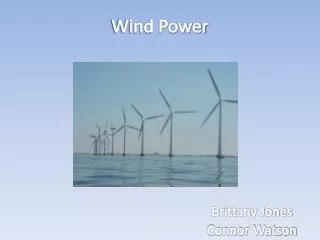
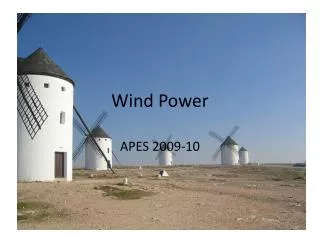
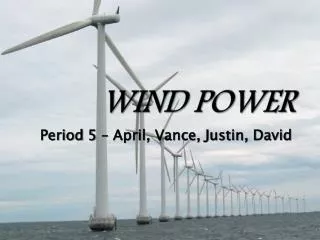
Wind Power Using wind energy to teach Mathematics
ResourcesVideo to get them interestedhttp://www.thefutureschannel.com/dockets/science_technology/wind_farming/ Middle School friendly • Kid Wind Project • Wind Power Curves • http://www.kidwind.org/PDFs/LESSON_windpowercurves.pdf High School friendly • Kid Wind Project • How to Collect & Analyze Local Wind Data • http://www.kidwind.org/PDFs/LESSON_localwinddata.pdf
Graphing data collected from SKYSTREAM 3.7 • Standards taught • 6.M.5.1.1 Read and interpret tables, charts, and graphs, including broken line graphs, bar graphs, frequency tables, line plots, and circle graphs. • 6.M.5.2.1 Collect, organize, and display the data with appropriate notation in tables, charts, and graphs, including broken line graphs, bar graphs, frequency tables and line plots. • 6.M.5.1.2 Explain and justify stated conclusions drawn from tables, charts, and graphs • 6.M.5.3.1 Find measures of central tendency – mean, median, and mode – with simple sets of data.
From the KidWind Project “Wind Power Curves” • Wind Power Curves in a Nutshell P. 5-6, Wind Power Curve Analysis P. 11, Answer Key P. 13 Using the SKYSTREAM 3.7 • Narrow down data collected from the SKYSTREAM 3.7 for the students to find average power out – then create their own wind power curve • wind data 1.csv • Data to make a wind power curve(1).xlsx • wind power curves project scoring rubric.docx • Discuss their graphs using some of the questions from the Analysis worksheet – questions they might have as a group
Using swept area to calculate power created at designated wind speeds • Standards taught • 6.M.2.1.4 Given the formulas, find the area of circles • 6.M.3.1.1 Discuss the meaning and use of variables in simple expressions and equations • 6.M.3.2.2 Evaluate simple algebraic expressions using substitution.
Calculation of Wind Power • Power in the Wind = 1/2pAV³ • Effect of air density, p - 1.225 • Effect of swept area, A – students figure d = 3.72m • Effect of wind speed, V – different wind speeds • Swept Area: A=∏r² Area of the circle swept by the motor (m²) • Have students try to find the power in the wind with some of the wind speeds off of their spreadsheet