
Uploaded by
isra
3 SLIDES
159 VIEWS
30LIKES
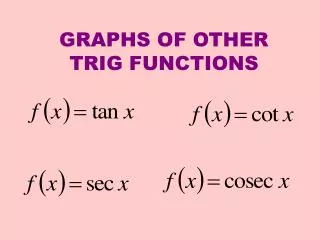
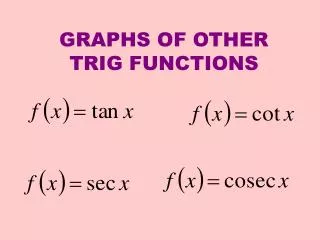
Graphing Secant and Cosecant Functions with Vertical Asymptotes
DESCRIPTION
This guide covers the process of graphing secant and cosecant functions. Begin by identifying the corresponding sine or cosine function from which these secant and cosecant graphs will be derived. Label the vertical asymptotes accurately, as they are crucial for understanding the graph's behavior. The graphing process involves starting from the maximum or minimum points of the sine or cosine function and moving upwards or downwards from each asymptote. Follow through with a visual example for clarity.
Download
1 / 3
Download Presentation 
Graphing Secant and Cosecant Functions with Vertical Asymptotes
An Image/Link below is provided (as is) to download presentation
Download Policy: Content on the Website is provided to you AS IS for your information and personal use and may not be sold / licensed / shared on other websites without getting consent from its author.
Content is provided to you AS IS for your information and personal use only.
Download presentation by click this link.
While downloading, if for some reason you are not able to download a presentation, the publisher may have deleted the file from their server.
During download, if you can't get a presentation, the file might be deleted by the publisher.
E N D
Presentation Transcript
Secant and cosecant • Graph the appropriate sine or cosine function • Label the vertical asymptotes • Start at each min/max and go up/down each asymptote
Example • Graph


More Related
Audio
Live Player