Download
1 / 19
260 likes | 660 Views
8.6B Speed, Velocity, and Acceleration. On Level Notes. You will learn:. State Objective : Differentiate between speed, velocity, and acceleration I can : If I give you real-life examples, can you tell me the difference between speed, velocity, and acceleration

E N D
8.6B Speed, Velocity, and Acceleration On Level Notes
You will learn: State Objective: Differentiate between speed, velocity, and acceleration I can: If I give you real-life examples, can you tell me the difference between speed, velocity, and acceleration Read graphs with data about speed and acceleration
Different Types of Speed • Average Speed • Most common • Will have a distance figure and a time figure • Constant Speed • Speed does not change • On a speed graph, this looks like a rising, diagonal line • On an acceleration graph, this looks like a flat plateau
Constant Speed in Graphs The are both graphs for the same thing: constant speed The graph on the left has distance over time (speed). The graph on the right is speed over time (acceleration). Always read the axes to make sure you know what its showing you.
How to calculate average speed from a graph? • Write your formula: s= d/t • Check your axes • Plug in your values • Calculate your answer
Practice Calculating Speed What is on the Y axis? What is on the X axis? To calculate speed, what 2 values do you need? At one second, what was the average speed of this object in m/s? Decimals are ok…just round to the nearest tenths place. Is the object moving between 19 and 20 seconds? How do you know?
Velocity: speed with direction • Speed and velocity are almost the same • Velocity is different because it includes the direction the object is traveling • If you are solving for velocity, you use the speed triangle • Your answer should include a direction Direction: North Up South Down East Left West Right
Can you find the velocity? 30 m/s South 20 miles per hour .6 mm / year to the right 348 seconds ½ mile 30 miles to the west 4 inches/yr left .97 m/s/s 85 km/min 29 cm/sec North
Velocity on a graph Look at the graph from earlier. Notice how this is distance over time, but they use the word “velocity”
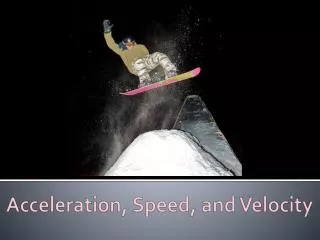
Who uses velocity? • Airplane pilots • They need to know how fast AND which direction they need to go • Meteorologists (Weather People) • They study the speed and direction of storms…just like the ice storm we just had! • Military Positions • They need to know at what angle to fire missiles, launch satellites, direct unmanned drones.
Acceleration: 3 ways to accelerate Fancy Definition: rate of how the velocity changes What it really means: Acceleration is speeding up, slowing down, or changing direction. Yes, it is really 3 things and not just speeding up.
Acceleration: caused by forces Acceleration is caused by unbalanced forces. To speed up, we need to apply a force to increase the speed of the object. To slow down, we need to apply a force in the front of the object to decrease the speed. Even if the object’s speed doesn’t change, a force is require to change its direction.
Acceleration on a Graph The Y axis is velocity or speed The X axis is time
Compare Speed and Acceleration on a Graph Really focus on your axes – which is it: speed or acceleration? This shows an object speeding up over time. Relationship: as the time increases, the acceleration increases
Comparing Speeds: moving or not moving These 2 graphs show balanced forces: the one on the left is moving in a straight line in a constant speed. The one on the right is at rest and will not move unless a force moves it.
Distance over time variety This graph shows the movement of an object over a period of time.
Comparing acceleration: changing speed or same speed Notice that this is speed over time: acceleration
Exit Ticket • What is the formula for Speed? • What is velocity? • What 3 ways can you accelerate?