Download

1 / 51
510 likes | 743 Views
Global Warming and Hurricanes. Thomas R. Knutson NOAA/Geophysical Fluid Dynamics Lab Princeton, New Jersey. Acknowledgements: Dr. Chris Landsea (NOAA/NHC) Dr. Kerry Emanuel (MIT) . Global Warming and Hurricanes: Historical Perspective and Future Outlook.

E N D
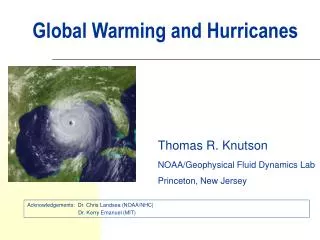
Global Warming and Hurricanes Thomas R. Knutson NOAA/Geophysical Fluid Dynamics Lab Princeton, New Jersey Acknowledgements: Dr. Chris Landsea (NOAA/NHC) Dr. Kerry Emanuel (MIT)
Global Warming and Hurricanes:Historical Perspective and Future Outlook • Global warming and its potential impact on the built environment (overview) • Historical observations: sea surface temperatures and hurricanes • Future simulations of tropical sea surface temperatures and hurricane intensity • Future research directions
Global Warming and Hurricanes:Historical Perspective and Future Outlook • Global warming and its potential impact on the built environment (overview) • Historical observations: sea surface temperatures and hurricanes • Future simulations of tropical sea surface temperatures and hurricane intensity • Future research directions
Surface Temperature Anomalies during most recent Inactive and Active Atlantic Major Hurricane Eras Inactive Era (July 1966 - Dec.1989) Active Era (Jan. 1995 – Aug. 2005) Data Source: HadCRUT2v (Climatic Research Unit, U.K.)
a) CM2.1 All Forcings Global Mean Surface Temperature Simulations: 1870-2000 Krakatau eruption b) CM2.1 Natural Forcings c) CM2.1 Anthropogenic Forcings
Paleoclimate evidence… Source: Petit et al., Nature, 1999. CO2 and temperature are highly correlated on glacial/interglacial time scales… Estimates of radiative forcing during last ice age: ~ -6.5 W/m2 (Hansen 1993) are comparable in magnitude to future positive forcing over the next 100-150 years under some IPCC scenarios…
Potential Impacts of Climate Change on the Built Environment • Heat and thermal stress • Infrastructure sensitive to thermal stress; heat mortality; wildfire risk • Floods and drought • Flood risk; agricultural impacts; wildfire risk • Sea level rise • Exacerbate coastal flooding, including from storm surge • Tropical cyclones • Increased wind damage, flooding from rains, and storm surge
# of models that predict increase in precipitation by 2100 in A1B scenario, out of 20 models used by IPCC/AR4 Red = wetter Blue = drier Source: Isaac Held, GFDL/NOAA
Potential increasing risk of great floods under future climate change… Modeled return period of 100-yr flood under 4xCO2 climate change Source: Milly et al. 2002, Nature, v. 415, p. 514-517. Based on one model (GFDL R30).
Global Warming and Hurricanes:Historical Perspective and Future Outlook • Global warming and its potential impact on the built environment (overview) • Historical observations: sea surface temperatures and hurricanes • Future simulations of tropical sea surface temperatures and hurricane intensity • Future research directions
Trends in Tropical Atlantic “Main Development Region” SSTs… Main Development Region
All Forcings (n=8) Why have Tropical Atlantic (MDR) SSTs warmed? GFDL CM2 coupled model historical simulations (1860-2000); Aug-Oct season Natural Forcings Only (n=4) Anthropogenic Forcings Only (n=4) 5-yr running means
NW Pacific Basin: Intensity vs. SST Minimum surface pressure (mb) The most intense storms occur at high SSTs Sea surface temperature (deg C) Source: Baik and Paek, J. Meteor. Soc. Japan (1998). Used with permission.
2005 N=28 Source: Chris Landsea, NOAA/National Hurricane Center. TK Added 2005 bar (unofficial). Note that 1933 had 21 named storms.
2005 N=7 Source: Chris Landsea, NOAA/National Hurricane Center. TK Added 2005 bar (unofficial).
Original PDI from Emanuel (2005) Revised PDI from Landsea (2005 - updated) Emanuel (2005)
Emanuel’s Multi-basin Tropical Cyclone Power Dissipation Index (PDI) has increased substantially over past 50 years, along with tropical SSTs Source: Kerry Emanuel, MIT, http://wind.mit.edu/~emanuel/anthro2.htm. SST anomaly (deg C) with arbitrary vertical offset. PDI scaled by constant.
Storm-Maximum Power Dissipation Index – Atlantic Basin Source: K. Emanuel, MIT, 2006
Atlantic Basin: SSTs vs number of tropical cyclones Source: Kerry Emanuel, MIT
Webster et al.: The percentage of hurricanes which reach Category 4-5 has increased in all basins, comparing two recent 15-year periods… Question: Are the historical data adequate for this conclusion? Source: Adapted from Webster et al., Science, Sept. 2005.
Knaff and Sampson’s reanalysis of 1966-87 NW Pacific max intensities produces a reduced Cat 4-5 trend, relative to “best track” Source: Knaff and Sampson, AMS Hurricanes Conference Proceedings, 2006
Sriver and Huber’s PDI from reanalysis, although weaker, is well-correlated after 1978 with Emanuel’s PDI from “best track” data (Atlantic + NW Pacific) Source: Sriver and Huber, Geophysical Research Letters, in press.
Georgia-New England Major Hurricanes 1851-2004 New England Major Hurricanes Source: Chris Landsea (NOAA/National Hurricane Center)
Conditions Associated With theActive 2004 Atlantic Hurricane Season Source: Chris Landsea (NOAA/National Hurricane Center)
A tale of three seasons… 1995…very active… but few strong U.S. landfalls 2004…active… four Florida hurricanes Category 2005… very active… four major U.S. Gulf Coast hurricanes
A tale of three seasons… 1995…very active… but few strong U.S. landfalls 2004…active… four Florida hurricanes 2005… very active… four major U.S. Gulf Coast hurricanes Plots: September 500mb geopotential heights
Global Warming and Hurricanes:Historical Perspective and Future Outlook • Global warming and its potential impact on the built environment (overview) • Historical observations: sea surface temperatures and hurricanes • Future simulations of tropical sea surface temperatures and hurricane intensity • Future research directions
GFDL Simulations: Hurricanes are more intense for warmer climate conditions …(~4% per deg C) Note: Min. central pressures are averages over day 5 of integrations. Source: Knutson and Tuleya, J. Climate, 2004.
GFDL Simulations: Hurricanes have significantly more near-storm rainfall for warmer climate conditions …(~12% per deg C) Average rainfall in a 32,700 km2 region of highest 6-hour accumulation (equivalent to 100km radius region).
Reality check: comparing models with observations… • GFDL Model wind speed intensity, V (and hurricane theory) vs SST: ~4-5% per oC • Emanuel (2005) for Atl, NW Pac, NE Pac: V3 increases 50% for 0.5oC, so V: ~30% per oC • Emanuel (2006) for Atlantic only: Century-scale data: V increases ~10% per oC; Data since 1980 only: ~20% per oC • Factor of 2 to 6 discrepancy in sensitivity… • Implications for future projections??
Resolving the Discrepancy? Possibilities: • Past trend of intensity over-estimated? (i.e.: the data is wrong) • Hurricane model/theory not sensitive enough to SST change? (i.e., the models are wrong) • Other factors besides SST which can affect potential intensity are playing a role? (i.e., our simple analysis is wrong)
Global Warming and Hurricanes:Historical Perspective and Future Outlook • Global warming and its potential impact on the built environment (overview) • Historical observations: sea surface temperatures and hurricanes • Future simulations of tropical sea surface temperatures and hurricane intensity • Future research directions
Where are we going from here? • Simulations of Atlantic hurricane frequency using nested regional models…
GFDL Zetac Nonhydrostatic Regional Model: 18km Tropical N. Atlantic Simulation Simulated hurricanes
Observed vs Simulated Atlantic Tropical Storm Tracks 1995: Active year 1982: Inactive year Observed (Aug-Oct) Observed (Aug-Oct) Simulation 2 (48-hr nudging) Simulation 2 (48-hr nudging) Category GFDL Zetac regional model, 18km resolution, large-scale nudged toward observed large scale
Tropical Storm Formation Tropical Storm Occurrence Hurricane Occurrence Observed Observed Observed Simulated Simulated Simulated Period of Simulation: August-October seasons, 1980-2005 Model: GFDL Zetac Regional Model with large-scale interior nudging to NCEP Reanalysis