Download

1 / 60
640 likes | 1.13k Views
Lecture 2. Study Designs: Overview, analytic techniques and measures of association/effect. Larry Holmes, Jr., Jobayer Hossain Research Statistics Lecture Series Nemours, DE - October, 2008. Research STATS. What do you see? Error!!! Bias!!!. Lecture Objectives.

E N D
Lecture 2 Study Designs: Overview, analytic techniques and measures of association/effect Larry Holmes, Jr., Jobayer Hossain Research Statistics Lecture Series Nemours, DE - October, 2008 Research STATS
Lecture Objectives • At the end of this presentation participants will be expected to: • Identify and describe the types of designs used to conduct clinical studies • Understand the selection of study subjects or participants in research • Identify the measure of association or effect • Estimate relative risk and odds ratio from cohort and case-control studies respectively
Why Design Strategies?Inappropriate study designs generate validity issues that cannot be corrected by statistics, however sophisticated the modelwe use “No intelligent person would underestimate the importance of mathematics in science or question the necessity for its correctness, but it cannot bring truth out of error. If it is applied to truth it will produce truth, and if it is applied to error it will almost certainly produce error” – Dingle H, 1958
Research Feasibilities: Health Care OutcomeApproaches Management Outcome Measures Patient Health Care Provider • survival • recurrence • new disease • treatment complications • health related quality of life • disease-specific impairments • satisfaction with care • financial & family burden • medical specialty • medical coverage/insurance • access to clinical trials • support group availability • prognostic factors • knowledge/interest learning about cancer • coping strategies • quality of life Treatment/Diagnostic • treatment recommendation • treatment given • appropriateness of treatment • pain/symptom management
Study Conceptualization: Framework Theory/ Knowledge/ Problems Synthesis & Hunches Inferences Re Conceptual Ho Conclusions and Interpretations Conceptual Hypotheses Inferences Re Operational Ho Study Design Empirical Findings Operational Hypotheses Data Collection Observations/ Data Data Analysis
Research conceptualization:Schematic representation of the natural history of disease STAGE OF SUSCEPTIBILTY PRE- CLINICAL DISABILITY DISEASESYMPTO- DISEASE OR RECOVERY MATIC TISSUE Resolution or CHANGES Pre-Pathogenesis Pathogenesis Sequelae LEVEL OF PREVENTION Primary Secondary Tertiary MODES OF Health Promotion Detection Treatment and INTERVENTION Specific Early Rehabilitation Protection Diagnosis Limitation of Prompt Disability Treatment Outcome Death E Clinical Disease Chronicity B D A C Clinical Horizon Residual Disability Inapparent or Subclinical
Research/Study Design Analytic Examine etiology, efficacy Descriptive To: Describe an experience, programs, treatment, unusual observation Experimental? Evaluate the efficacy of a therapeutic , or other interventions Observational Association of cause and effect Comparison between 2 treatments • Examples: • Case Reports • Case series • 3) Ecological study • Examples: • Clinical Trial • Community trial Examples: 1) Cross-sectional 2) Case-control 3) Cohort Meta-analysis? Combination of studies
Ecological Study Design The strategy is based on determining whether those ecological units with a high frequency of exposure also tend to be the groups with a high frequency of health outcome occurrence. Measure group rates of the health outcome and exposure prevalence for the same population group, but not necessarily using the same source of data. Types of comparisons: Geographical or group comparisons, e.g., countries or administrative units. Temporal comparisons Combines geographic and temporal comparisons Time-series studies.
Cross-Sectional Study Cross-sectional studies typically conducting a medical survey in a community or defined population – orthopedic hospital. Key steps in conducting a cross-sectional medical survey are: To identify the base population To choose a sampling design and sampling frame for selecting the study participants To measure exposure (spine fusion) and health outcome status (post-operative pancreatitis) on the study subjects. A critical aspect of conducting a medical surveys is the logistical plans for examining the subjects and obtaining and processing any biological specimens. Cross-sectional studies may also be based on existing records. For example, a study using data from Fracture Registry to evaluate the association between osteopena or ontogenesis imperfecta and repeated fractures
Cross-sectional design Sampled or surveyed population Exposure – risk present (eg. Developmental motor delay) – (n?) Non-exposure – risk absent (eg. No developmental motor delay) – (n?) Disease – thoraco lumbar kyphosis (TLK) progression (n1 ?) Non-disease (n2?) Disease – TLK progression (n?) Non-disease – (n?) Prevalence (PE) – n1/(n1 + n2) Prevalence (PU) – n1/(n1 + n2) Relative prevalence – PE/PU - Using 2x2 table a/(a+b) / c(c+d). Prevalence odds ratio – ad/bc
Measuring Association in a Cross-Sectional Study Simplest case is to have a dichotomous outcome and dichotomous predictor variable Everyone in the sample is classified as diseased or not and having the risk factor or not, making a 2 x 2 table The proportions with disease are compared among those with and without the risk factor
2 x 2 table for association of disease and exposure Disease Yes No Yes a + b b a Exposure c + d c d No N = a+b+c+d a + c b + d
Prevalence ratio of disease in exposed and unexposed Disease Yes No a a Yes b a + b PR = Exposure c c d c + d No
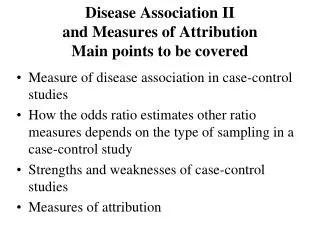
Case-ControlStudy Is a study that starts with the identification of persons with the outcome of interest and a suitable control group of persons without the outcome. The relationship of an exposure to the outcome is examined by comparing those with and without the outcome with regard to how frequently the exposure is present, or if quantitative, the levels of exposure in each of the groups Syn: Case-referent Study; Retrospective Study;
What is a case-control study? Case-control study is a method of sampling a population in which cases of disease are identified and enrolled, and a sample (controls) of the population that produced the cases is identified and enrolled. Exposures are determined for individuals in each group.
What is a case-control study?(Cont’d) Case-control study has two groups (case group and control group): one group has the disease of interest (cases) and a comparable group is free from the disease (controls). The case-control study identifies possible causes of disease by finding out how the two groups differ with respect to exposure to the study factor of interest and other factors.
Whatever selection factors in the referral system affected admissions of cases to a certain hospital would also affect the admission of hospital controls.
Characteristics of the Case-Control Study A single point of observation. Defined by presence or absence of the outcome. Exposure is determined retrospectively. Does not directly provide incidence data.
Design of a Case-Control Study Hallmark of the case-control study is that it begins with people with the disease (case) and compares them to people without the disease (control). This is in contrast to the design of a cohort study
Design of a case-control study. A, Starting with cases and controls.
Design of a case-control study. B, Measuring exposure in both groups.
Design of a case-control study. C, Expected findings if the exposure is associated with disease.
Odds Ratios in Case-Control Study Odds of an event is defined as the ratio of the number of ways the event can occur (P) to the number of ways the event cannot occur (1-P). Odds= _P__ 1 - P If probability of winning n= 60% Then, odds of winning = 60%/(1-60%) = 60%/40% = 1.5.
Analysis in Case-Control Studies Odd Ratio (OR) – crude and adjusted (from multivariate statistical analysis) OR ~= RR when disease is rare and cases/controls representative of all cases/population with regard to exposure.
Interpretation of an Odds Ratio (OR) OR=1 implies no association. Assuming statistical significance: OR = 2 suggests cases were twice as likely as controls to be exposed, or cases were 2 times more likely to be exposed than controls. Above Example: Patients with CHD were 1.62 times more likely to be smokers than controls without CHD. OR < 1 suggests a protective factor.
What is a cohort? A cohort is defined as a population group, or subset thereof, that is followed over a period of time. The term cohort is said to originate from the Latin cohors, which referred to one of ten divisions of an ancient Roman legion.
What is a cohort? (cont’d) Cohort group members experience a common exposure associated with a specific setting (e.g., an occupational cohort or a school cohort) or they share a non-specific exposure associated with a general classification (e.g., a birth cohort—being born in the same year or era).
COHORT STUDIES Follow-up studies, longitudinal studies, and incidence studies Cohort study is the method in which subsets of a defined population can be identified who are, have been, or in the future may be exposed or not exposed to a factor or factors hypothesized to influence the probability of occurrence of a given disease or other outcome.
Historical Cohort Studies Retrospective Cohort Studies. When the cohort(s) are assembled from past records. Follow-up can be either in the present or from more recent past records. Historical cohort studies may study either general population cohorts or specific exposure cohorts.
Structure of a Cohort Study DISEASE EXPOSED NON-CASES NO DISEASE RANDOM SAMPLING SOURCE POPULATION DISEASE NON-EXPOSED NO DISEASE PREVALENT CASES FOLLOW-UPOUTCOME
Design of cohort study TIME Exposure Disease Study group Present Comparison Group Absent Disease rate for exposed = a a + b for nonexposed = c c + d a a+ b Relative Risk = c c+ d a Present b Absent c Present Absent d
Design of a Cohort Study Start with a group of subjects who lack a positive history of the outcome of interest and are at risk for the outcome. Include at least two observation points: one to determine exposure status and eligibility and a second (or more) to determine the number of incident cases.
Design of a Cohort Study(cont’d) Permit the calculation of incidence rates. Can be thought of as going from cause to effect. Involve the collection of primary data.
If we observe an association between an exposure and a disease or another outcome, the question is: Is the association causal?
Prospective Cohort Study Purely prospective in nature; characterized by determination of exposure levels at baseline (the present), and follow-up for occurrence of disease at some time in the future.
Figure 9-6. Time frame for a hypothetical prospective cohort study begun in 2004.
Advantages of Prospective Cohort Studies Enable the investigator to collect data on exposures; the most direct and specific test of the study hypothesis. The size of the cohort is under greater control by the investigators.
Advantages of Prospective Cohort Studies (cont’d) Biological and physiological assays can be performed with decreased concern that the outcome will be affected by the underlying disease process (e.g., cholesterol levels or nutrient levels). Direct measures of the environment (e.g., indoor radon levels, electromagnetic field radiation, cigarette smoke concentration) can be made in order to define exposures precisely.
Retrospective Cohort Study Despite substantial benefits of prospective cohort studies, investigators have to wait for cases to accrue. Retrospective cohort studies make use of historical data to determine exposure level at some baseline in the past.
Time frame for a hypothetical retrospective cohort study begun in 2004.
Figure 9-8. Time frames for a hypothetical prospective cohort study and a hypothetical retrospective cohort study begun in 2004.
Advantages of Retrospective Cohort Studies A significant amount of follow-up may be accrued in a relatively short period of time. The amount of exposure data collected can be quite extensive and available to the investigator at minimal cost.