Download
1 / 13
130 likes | 375 Views
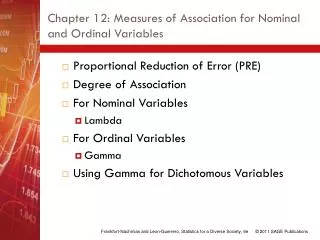
Chapter 12 Measures of Association. Chapter Overview. In many circumstances, the purpose of research is to investigate relationships between variables rather than to compare group differences.

E N D
Chapter Overview • In many circumstances, the purpose of research is to investigate relationships between variables rather than to compare group differences. • Introduce the methods and statistical analysis of research into relationships or correlations between variables. • The type of data dictates the appropriate statistical approach, and the statistical approach affects how results are interpreted. • Recognize and understand the relationships between variables. • There are limitations to the conclusions that can be appropriately drawn from statistical results. • Probability estimates can be, and often are, provided in association with point estimates of association. • The interpretation of p-values requires some elaboration.
Purpose and Methods • Knowledge of the association between variables can inform health care practice: • About the association between characteristics that individuals possess • About the association between external events and individual characteristics • The relationship between events and population values Several Considerations Related to the Research Methods Investigating Association Measurement error and data validity: • The less precise ameasurementis, the lower the association between that variable and any other variable, unless the direction and magnitude of error are similar for each. • It is possible to have a strong relationship between two variables but the strength of the relationship is underestimated due to measurement imprecision.
Measurement Error and Data Validity • If a measurement is reliable and fairly precise, a strong association may be found. The interpretation of the association may be misleading, however. • The investigator and research consumer must consider the following when interpreting and applying the results of research into the association between variables: • Timing and a complete description and careful consideration of the sample tested. • The more homogeneous a sample, the more likely the strength of the association between variables will be underestimated. • Consider whether the sample studied truly represents the range of the population of interest. • Generalization of results into clinical practice is a judgment of the clinician, but the investigator must provide sufficient description.
Data Analysis and Regression Analysis Data Analysis • Whenanalyzing data to estimate the strength of an association between variables, first determine the type of data at hand. Regression Analysis • The fundamental statistic for the analysis of interval and ratio data to estimate the strength of the association between variables. • ANOVA is a special case of regression. • Simple linear regression is the simplest form of regression.
Regression • Simple linear regression, or Pearson Product Moment Correlation (PPMC), designated as a Pearson r or simply an r value, is used to measure the strength of the association between pairs of data that are interval or ordinal. • Correlation coefficients can be quickly calculated with commercial software, but the formula is: r = N∑ XY – (∑X)(∑Y) / √ N∑X2 – (∑X)2 √N∑Y2 – (∑Y)2 • where N = the number of pairs of data, X = the values of one variable, and Y = the values of the second. • It is possible to estimate the association between multiple variables through multiple regression. This is conceptually similar to adding variables or levels of variables and performing ANOVA rather than a t-test. • The use of statistical packages allows for more data and more complex designs to be managed in a rapid fashion.
Regression (continued) • When multiple regression is performed, the process yields an R2 value. • An R2 value isthe variance in the criterion variable (Y) explained by a predictor variable (X) or predictor variables. • Multiple regression: R2 values • PPMC: r values • The product of (r)2 = R2 or when PPMC is squared, the value is equal to what was obtained through multiple regression. • The relationship between r and R2 confirms that the PPMC is a special case of multiple regression. • It is possible to explore the relationships between variables while controlling for the influence of other variables through the calculation of partial and semipartial correlations.
Interpreting R and R2 • A p-value is an indication that the differences observed when studying a sample are reflective of true population differences. • The p-values found in association with r and R2 relate to hypothesis testing and are of little value when considering the meaningfulness of an association between variables. • If a p-value is not informative, then the research consumer is most concerned with the R2 value or the portion of variance in Y explained by the predictor variable(s). • The usefulness of the R2 value is revealed when one considers the interpretation of r values.
Interpreting R and R2 • Investigators and statisticians have provided some guidelines for interpreting r values.
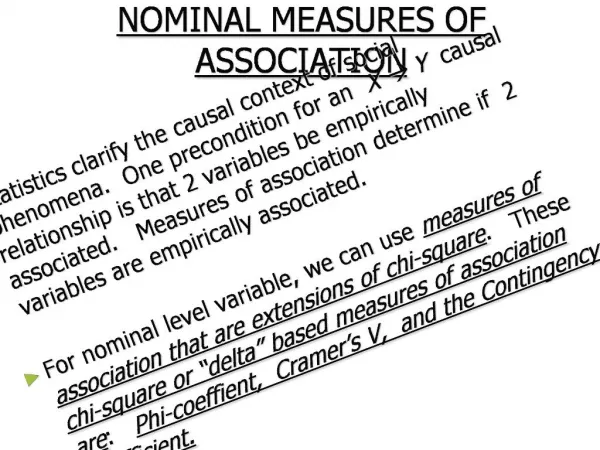
Measures of Association • Measures of association do not imply cause and effect. • Interpreting the strength and importance of measures of association and teasing out cause and effect relationships requires knowledge of the subject matter and careful critical appraisal rather than reference to a published scale, which can potentially mislead. • Although measures of association cannot confirm cause and effect, these analyses can build useful predictive models. • The values of the predictor variables in fact predict the value of the criterion value. • The prediction model does not imply cause and effect but is rather a means of predicting an outcome in one measure, based on the values of predictor measures.
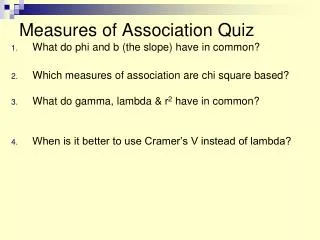
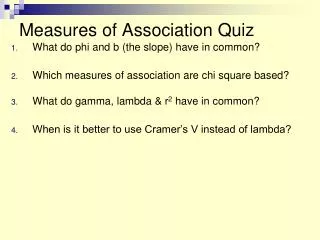
Managing Ordinal and Nominal Data • The analysis used most often for ordinal data is a Spearman rank order correlation. The result is designated as a Spearman r. • The formula for a Spearman rank order correlation is as follows: Spearman r = 1 – ((6∑d2) / n(n2 – 1)) • d = the difference in ranks between pairs of data, and n = the number of subjects. • The analysis of the association between ordinal values is more complicated than those for ordinal, interval, or ratio data. The most common approach is a Cramers’ V correlation, which is based on Chi square (X2 ) values. • One application of an X2 analysis is to test the hypothesis that two nominal variables are independent. • If the null hypothesis that two variables are independent is rejected, a Cramer’s V can be calculated to measure the strength of the relationship.
Association vs. Cause • Cramer’s V analysis can identify a relationship, but it may have no suggestion of cause and effect. • In some cases, two variables may appear highly associated due to correlation with a third variable. • It requires more than measures of association to establish cause and effect. • In some cases, experimental designs can test hypotheses of cause and effect derived from studies of association. In other cases, cause and effect is established through evidence. • It is important to note that because Spearman r and Cramer’s V are nonparametric statistics, the square of these values is meaningless. • The interpretation of these statistics requires knowledge of the literature on the question being addressed and the nature of the data in making informed decisions regarding studies that address the association between variables.
Chapter Summary and Key Points • Knowledge of the association between variables can inform health care practice. • The less precise a measurement, the lower the association between that variable and any other variable. • Validity of data may or may not affect the strength of the relationship between two measurements. • Generalization of results into clinical practice is a judgment of the clinician and requires thoughtful decisions on the part of the investigator. • Regression analysis is the fundamental statistic for the analysis of interval and ratio data to estimate the strength of the association between variables. • P-values relate to statistical differences but offer little to understanding clinical meaningfulness. • Because Spearman r and Cramer’s V are nonparametric statistics, the square of these values is meaningless.