Download
1 / 16
170 likes | 284 Views
The Production Possibilities Curve (PPC) visually illustrates the trade-offs in an economy producing two goods, showcasing the efficiency of resource allocation between them. It demonstrates how the production of one good affects the quantity of another due to opportunity costs. The chapter further explores economic systems, differentiating between market and command economies, and introduces the Circular-Flow Diagram, which represents economic transactions and the interdependence of households and businesses. Understanding these concepts is crucial for grasping economic dynamics.

E N D
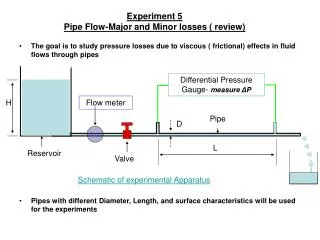
I. The Production Possibilities Frontier (curve) The PPC is an illustration of the trade-offs facing an economy that produces only two goods. It shows the maximum quantity of one good that can be produced for any given production of the other.
The Production Possibility Frontier Quantity of coconuts D 30 Feasible and efficient in production Not feasible A 15 B Feasible but not efficient 9 C Production possibility frontier PPF 0 20 28 40 Quantity of fish
Increasing Opportunity Cost Quantity of coconuts Producing the first 20 fish . . . …requires giving up 5 coconuts 35 But producing 20 more fish . . . 30 A 25 20 …requires giving up 25 more coconuts… 15 10 5 PPF 0 10 20 30 40 50 Quantity of fish
Economic Growth Quantity of coconuts Production is initially at point A (20 fish and 25 coconuts), it can move to point E (25 fish and 30 coconuts). Economic growth results in an outward shift of the PPF because production possibilities are expanded. The economy can now produce more of everything. 35 E 30 A 25 20 15 10 5 Original New PPF PPF 0 10 20 25 30 40 50 Quantity of fish
PPC Practice • Draw a PPC showing changes for each of the following: • Pizza and Robots • 1. New robot making technology • 2. Decrease in the demand for pizza • 3. Mad cow disease kills 85% of cows • Consumer goods and Capital Goods • 4. BP oil spill in the Gulf • 5. Faster computer hardware • 6. Many workers unemployed • 7. Significant increases in education
Question #1 New robot making technology Q A shift only for Robots Robots Q Pizzas
Question #2 Decrease in the demand for pizza Q The curve doesn’t shift! A change in demand doesn’t shift the curve Robots Q Pizzas
Question #3 Mad cow disease kills 85% of cows Q A shift inward only for Pizza Robots Q Pizzas
Question #4 BP Oil Spill in the Gulf Q Decrease in resources decrease production possibilities for both Capital Goods (Guns) Q Consumer Goods (Butter)
Question #5 Faster computer hardware Q Quality of a resource improves shifting the curve outward Capital Goods (Guns) Q Consumer Goods (Butter)
Question #6 Many workers unemployed Q The curve doesn’t shift! Unemployment is just a point inside the curve Capital Goods (Guns) Q Consumer Goods (Butter)
Question #7 Significant increases in education Q The quality of labor is improved. Curve shifts outward. Capital Goods (Guns) Q Consumer Goods (Butter)
II. Economic Systems • The two general types of economic systems seek to address the economic problem in differing ways. • In the market system, individual choice (desires of suppliers and demanders) is key to addressing the economic problem. • In the command system, government direction (through central planning entities) is key to addressing the economic problem.
III. The Circular-Flow Diagram • This is a model that represents the transactions in an economy by flows around a circle. It demonstrates the interdependence between households and businesses in a market economy. • Some basic concepts: • Household: Aperson or group of people that share their income. • Business: Organization that produces goods and services for sale. Sometimes displayed as “firm” on this diagram. • Firms sell goods and services in the product market. • Firms buy resources they need to produce in the factor (or resource) market.