Download

1 / 32
320 likes | 473 Views
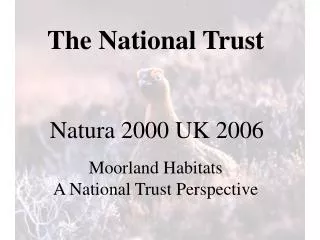
Event Evaluation Perspectives from the National Trust. Presentation prepared by: Stephen Calver, Head of the Market Research Group Celia Mead, Customer Services Manager, The National Trust Thursday 11 th January. Size and scope.

E N D
Event Evaluation Perspectives from the National Trust Presentation prepared by: Stephen Calver, Head of the Market Research Group Celia Mead, Customer Services Manager, The National Trust Thursday 11th January
Size and scope • The National Trust offers over 10,000 events per annum in England, Northern Ireland and Wales • These generate over £5mn of direct revenue • The National Trust is a charity that relies upon its commercial efficiency to achieve its conservation aims.
Why evaluate? • To measure the extent of engagement and understanding • Have visitors enjoyed themselves? • How can operational efficiency be improved? • How can marketing and planning be better targeted?
Classification of events • ‘Value added’ events • Interpretative walks and tours • Income generating events • Temporary exhibitions • Large scale public events – private hire
The dataset The data for evaluation is obtained from three primary sources • National Heritage Survey • National Visitor Survey • Events Survey
Target Groups • ABC1/C2 Socio economic groups (Market Research Society Algorithm) • MOSAIC Geo-demographic analysis from postcodes • Members/ Non members of the National Trust • Young families – children 0-11yrs • Older families – children 12-15 • Independents • Older independents
National Heritage Visits Survey • Conducted annually, national coverage to evaluate role of heritage visits in the national leisure ‘portfolio’ • Questions derived from small group, qualitative research • Quota sampling, face to face interviewing of sample population • Data collected since 1998
National Visitor Survey • All large properties (by visitor number) nationwide participate plus a sample of smaller properties and ‘open site’ properties. • Questions derived from qualitative research. • Self completion questionnaire, control groups of face to face interviews, depth interviews • Data collected since 2000 nationally; since 1992 for some regions of the National Trust • Database of over 250,000 cases
Events Survey • Introduced in 2006 in the Wessex Region • Questions derived from qualitative research • Quota sampling, face to face interviewing at key properties
The Heritage Visits Survey Battle enactments at Corfe Castle • 2006 survey includes 5 questions specifically investigating attitudes and behaviour regarding events at historic properties. • The following slides give details from two of them Egyptian Art exhibition at Kingston Lacy
‘Would you be interested in any of the following activities at National Trust properties’? % Heritage visits survey 2006 Base 827
‘Have you attended any of the following types of event at an historic property during the past 12 months?’ % ‘Special Days’ e.g Apple Fairs, Book Fairs Heritage visits survey Base 827
What was the purpose of your visit today? Please tick one box only Pay for entry, Non event specific % The top six motivators include a mix of pragmatic factors (house, garden, walk) and experiential (a nice day out). 2006 National Visitor Survey Base 37520
There is a strong link between purpose of visit and length of stay at the property (and therefore spend). The average proportion of the visitor population staying longer than 3hrs at National Trust properties is 31% There are 5 motivational categories that stay longer than average To Show Family and Friends - 46% more than 3 hrs A Nice Day Out - 45% more than 3 hrs To attend an event - 40% more than 3hrs Interest in Art - 36% more than 3hrs Things for Children to do - 34% more than 3hrs 2006 National Visitor Survey Base 37520
Do event visitors have a different planning schedule to other visitors? % 2006 National Visitor Survey Base 37520
Which media prompted the visit? % 2006 National Visitor Survey Base 37520
Television and film promote specific properties and provide themes for events
Variation in points of origin?% 2006 National Visitor Survey Base 37520
Events Research 2006 Afternoon performances are popular with families Falconry displays and other rural ‘crafts’ are popular with mixed groups
‘Which of the following have provided you with the information to attend an event in the past 12 months’? % 2006 Events survey Base 476
How important was this event in your decision to visit today? (Property Open) % 2006 Events survey Base 476
How important were the following for your visit today? (Property open) Very Important% *‘Entertaining children’ (only respondents with children) 2006 Events survey Base 476
Fifteen categories have been identified which represent critical measures of evaluation by the visitor. There is a strong positive relationship between five of these categories and attendance at cultural events generally. There is a strong positive relationship between five of these categories and motivation to visit Evaluation of concerts, plays and other ticket events ‘Concerts, plays and other events requiring a ticket. How would you rate this event with regard to the following’ Timely promotion of event Very good _ _ _ Very Poor 2006 Events survey Base 476
Example – Evaluation related to attendance at cultural events and motivation to attend event Attendance at cultural events – 4 times a year Entertaining the children Timely promotion of the event Access and parking Ease of booking Location of event at property Ease of obtaining further information Seating arrangements/ space allocation Access and parking Guides programmes and other information Seating arrangement Ease of obtaining further information
Fourteen categories have been identified which represent critical measures of evaluation by the visitor. There is a strong positive relationship between four of these categories and attendance at cultural events generally. There is a strong positive relationship between four of these categories and motivation to visit Evaluation of Exhibitions, fairs, enactments, walks and interactive events Attendance at cultural events – 4 times a year Available information before the visit Information and explanation from staff Opportunities for interaction Access and parking
MOSAIC Groups • MOSAIC is a commercial segmentation package produced by Experian; it classifies all consumers in the United Kingdom into 11 groups subcategorised into 61 types. • MOSAIC provides a useful means of understanding consumer attitudes and predisposition in order to direct marketing strategy and evaluation of marketing.
MOSAIC group analysis- Large ticket event/ Wessex % UK POPULATION Symbols of success 10% Happy Families 11% Suburban Comfort 15% Ties of the Community 16% Urban Intelligence 7% Welfare Borderline 6% Municipal Dependency 7% Blue Collar Enterprise 11% Twilight Subsistence 4% Grey Perspectives 8% Rural Isolation 5%
MOSAIC group analysis –Value added events/Wessex % UK POPULATION Symbols of success 10% Happy Families 11% Suburban Comfort 15% Ties of the Community 16% Urban Intelligence 7% Welfare Borderline 6% Municipal Dependency 7% Blue Collar Enterprise 11% Twilight Subsistence 4% Grey Perspectives 8% Rural Isolation 5%