Phytoplankton
230 likes | 475 Views
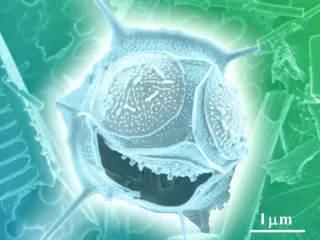
Phytoplankton. Michael L. Parsons Coastal Watershed Institute Florida Gulf Coast University. Phytoplankton (microalgae). Cyanobacteria ( Microcystis ). Diatom ( Actinoptychus ). Chlorophyte. Diatom ( Pseudo-nitzschia ). Dinoflagellate ( Karenia brevis ). Silicoflagellate.

Phytoplankton
E N D
Presentation Transcript
Phytoplankton Michael L. Parsons Coastal Watershed Institute Florida Gulf Coast University
Phytoplankton (microalgae) Cyanobacteria (Microcystis) Diatom (Actinoptychus) Chlorophyte Diatom (Pseudo-nitzschia) Dinoflagellate (Karenia brevis) Silicoflagellate Diatom (Chaetoceros) Dinoflagellate (Gambierdiscus) Haptophyte
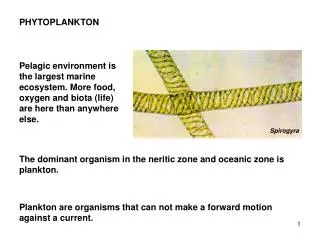
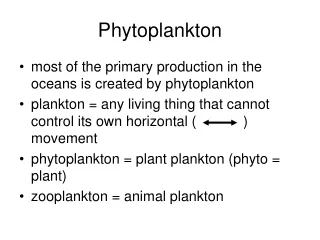
Overview • The Good: phytoplankton are the base of the foodweb • The Bad: too much can have negative impacts • The Ugly: some phytoplankton can produce toxins that can kill animals and make people sick
Phytoplankton Growth Requirements • Light • Nutrients (nitrogen, phosphorus, carbon, other compounds) • Can serve as indicators of nutrient loading and light availability
The Good fish phytoplankton nutrients plankton
Phytoplankton and the Caloosahatchee • Many factors that affect the growth of phytoplankton in the Caloosahatchee are controlled/influenced by the flow of the river. • As flow increases: • nutrients phytoplankton • residence time phytoplankton • salinity assemblage shift
flow nutrients phytoplankton Doering et al. 2006
flow residence time phytoplankton Wan et al. 2013
flow residence time phytoplankton Wan et al. 2013
Red Tides and Caloosahatchee Discharges Brand, unpub.
“The combined flux of N and P from TB, CH, and the Caloosahatchee River could theoretically supply 11–50% of the N and 11–57% of the P required to support growth of the measured population abundance for each of the three blooms”
Workshop Questions • What driver is the indicator sensitive to? • Nutrients, salinity, light • What constitutes a healthy population of the indicator? • Low/moderate cell concentrations; more diatoms and less cyanobacteria and flagellates • Is the indicator a valued component of the Caloosahatchee system? • Should be! • What metrics are appropriate for assessing this indicator? • Chlorophyll concentrations; species identifications
Workshop Questions • What are the strengths and limitations of this indicator? • Chlorophyll is an easy (and strong) response variable to measure • Cofounding factors (salinity and nutrients; flow and residence time) • What are the relevant gaps and uncertainties in our understanding of the relationship between drivers/stressor and indicator response? • Teasing out nutrient loading versus residence time • Role of Caloosahatchee in red tides • Could our use of this indicator be improved to address additional drivers/stressors? • Yes – can help to optimize flow regimes in different conditions • Next steps? • River and red tides • Assemblage shifts versus flow