Download
1 / 34
340 likes | 495 Views
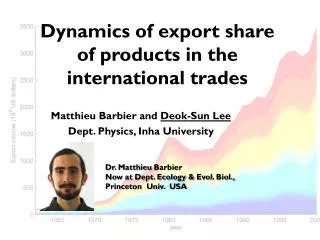
Dynamics of export share of products in the international trades. Matthieu Barbier and Deok -Sun Lee Dept. Physics, Inha University. Dr. Matthieu Barbier Now at Dept. Ecology & Evol . Biol., Princeton Univ. USA. International trades.

E N D
Dynamics of export share of products in the international trades MatthieuBarbier and Deok-Sun Lee Dept. Physics, Inha University Dr. MatthieuBarbier Now at Dept. Ecology & Evol. Biol., Princeton Univ. USA
International trades • if there are comparative advantage of importing rather than producing a product given factors of production, politics, culture, history, etc.D. Ricardo, On the Principles of Political Economy and Taxation (London: John Murray, 1817; retrieved 2012-12-07 via Google Books) • What products are the whole world producing and exporting? • Any fundamental “laws” there?
Products that Korea is producing and exporting 1962 2000 http://atlas.media.mit.edu/
Products the whole world is producing and exporting 1962 3330 Petrol.oils & crude oils obt.frombitumin.minerals 0711 Coffee,whether or not roasted or freed of caffeine 2631 Cotton (other than linters),not carded or combed 2320 Natural rubber latex; nat.rubber & sim.nat.gums 2681 Seeps or lambswool,greasy or fleece-washed 2000 3330 Petrol.oils & crude oils obt.frombitumin.minerals 7810 Passenger motor cars,for transport of pass.& good 9310 Special transactions & commod.,not class.to kind 5417 Medicaments(including veterinary medicaments) 7788 Other elect.machinery and equipment
Statistics and dynamics of • “Export share” of products • empirical observation • what are we interested in?
NBER-UN world trade data from 1962 to 2000 • R.C. Feenstra, R. E. Lipsey, H. Deng, A. C. Ma, and H. Mo, World Trade Flows: 1962-2000, NBER Working Paper No. 11040 (2005) • Product ID 4-digit Standard International Trade Classification (SITC), revision 2 • Mainly based on the importers’ reports • Curated and supplemented by the available data of trades of individual countries year icode importer ecode exporter sitc4 unit dot value quantity . . . . . . . . . 132627 1962 218400 USA 454100 Korea Rep. 8310 1 1 NA 132628 1962 218400 USA 454100 Korea Rep. 8420 1 564 NA 132629 1962 218400 USA 454100 Korea Rep. 8471 1 1 NA . . . . . . . . .
Export share of a product p in year t • Export volume (value in dollars) of a product p in year t : • Export share (relative export volume) of a product p in year t : • 508 products maintain non-zero volume from 1962 to 2000 • Normalization , Mean This quantity is what we study here
Uneven distribution of export share SITC 3330 Crude oil: Power law behavior with exponent between 2 and 3 is observed for for all years. The functional form of the distribution does not change with time The second moment increases slightly with time with anomalous peaks after oil shock (1973)
Growth or decay for 39 years • Increase or decrease? How much? • Growth rate • Skewed distribution • What products increase share and what do the opposite in the international trades? What is the law governing it? Coal and water gas(3415) Invalid carriages (7853)
Variation of share for one year- relatively microscopic view Loss : Gain : Linear scaling both for gain and loss of share !
Our viewpoint, strategy, and goal Hidalgo et al., Science (2007) • Construct a particle-hopping model consistent with the linear scaling between and • Can the model explain the empirical observations such as the broad distribution of share? • Can the model predict the evolution of share of individual products?
Urn model with quadratic preferential selection • Factorized steady state • Pseudo-condensation
Urn model (or misanthrope process) as a model for the dynamics of export share • A complete graph of N sites, each site representing a product • A total of Mparticles, each particle representing the unit of share • Each site has particles and specifies the system’s state () • At each (microscopic) time step wo sites i and j are selected with probability and a particle at site i is transferred to site j, where with
Example: N=14 M=35 Every site has at least one particle We consider the case where N is very large
Why is it quadratic, not linear? • To be consistent with the linear relation between and • The annual variation of a product’s share is the sum of plus and minus like random walk • Suppose that particle-hopping occurs times for one year. Then • A parameter is introduced: • One year corresponds to times of transfer of particles or (empirical)
Urn model with quadratic preferential selection • Different from the zero-range process in that the particle-hop probability depends on the number of particles of the destination as well as of the source • Particle-hop probability is proportional to the square of the number of particles in the source and destination site • Each unit of share (particle) is likely to move with probability proportional to the share of the present product and that of the destination product • Our model is therefore capturing (only) the trend of a country’s economic policy towards enhancing the likelihood of profit beyond the different abundance/deficiency of factors of production from country to country. • Related worksGodrèche, Bouchaud, Mezard, JPA 28, L603 (1995) – model A, B, CGodrèche and Luck, EPJB 23, 473 (2001) – zeta urn modelMajumdar, Evans, Zia PRL (2005); Evans, Majumdar, and Zia, JSP 123, 357 (2006) -- condensationBarabasi and Albert, Science (1999) – (linear) preferential attachment of links
Relation to empirical results • Distribution of share corresponds to the distribution of the number of particles, which can be obtained analytically for the stationary state • Is the broad distribution of share caused by the linear scaling between and ? • Can the model predict the trajectory of share of individual product? Urn model based on ?
Factorized steady state • : Probability of a specific particle configuration at time t • Factorized state assumed for the stationary state with to be determined • Detailed balance condition • Function f: where is used. Evans and Hanney, JPA 38, R195 (2005)
Single-site particle-number distribution • Partition function • Grand partition function with • Partition function (inverse Mellin) • Probability that a single site has m particles Evans and Hanney, JPA 38, R195 (2005)
Partition function in our model • Logarithmic singularity of the generating function at (J.E. Robinson, Phys. Rev. 83, 678 (1951)) • Partition function at the saddle point, which exists within the radius of convergence(otherwise, condensate is formed) in case with particle density Steepest descent path
Single-site particle-number distribution in our model • with • A bump is formed for for the last two cases
Condensate-free Approximate
Condensate … Approximate
Condensation? • Nature of condensation has been studied for the (continuum) mass transfer model in 1D (Majumdar, Evans, Zia PRL (2005); Evans, Majumdar, and Zia, JSP (2006)) • If the particle-hop probability is given by , the single-site particle-number distribution is • If , it may happen that even for finite . • If , can be infinite and can be equated to any finite by introducing a suitable cutoff leading to exponential decay. However, if is infinite, we should compare and , both of which are large numbers, and depending on the relation between and , a pseudo-condensate can appear • International trade dynamics is at the edge of condensation-free phase.
Application • - Does this model explain the international trade • at the aggregate level and individual level?
Yes! it does at the aggregate level Simulate the model with and the initial values from the 1962 data Second moment Share distribution Growth-rate distribution Gain versus share Loss versus share
Evolution of export share of individual products • An ensemble of simulation results • The middle 80% of the simulation values for is shaded Bad… Not bad….
Quantifying the typicality of empirical observations among simulated trajectories • Values of return (one-year growth rate) are compared between real and simulation for each p and t. That is, we have one and K=300 simulation values • Normalized rank • If a product p is well predicted by the model, a total of T=39 such normalized ranks at different years should be uniformly distributed over [-1/2, 1/2] • Deviation from Uniformity : i) sort T=39 values of ’s in increasing order from the smallest to the largest such that . If they are uniform, then one would find for iii) Non-uniformity or Unpredictability of a product p is defined as • is observed only with probability 0.05 for 39 uniformly-distributed numbers(Marhuenda, Morales, Pardo, Statistics 39, 315 (2005))
Classifying products Mean rank positive: higher returns (annual growth) than expectednegative: lower returns than expected Rank fluctuation Larger than 0.29 : higher variability of rank than expected Smaller than 0.29 :lower variability Unpredictability Larger than 0.1 : deviate significantly from our model prediction Smaller than 0.1 : predictable by the model
The most unpredictable products Raw materials and agricultural products Mostly they have their share fall behind prediction.
Products with unpredictably increased share Medical appliances, toys, cosmetics They are not exclusively subject to economic demands
Products with the largest fluctuation of rank Railways, warships, uranium, Nuclear reactorsOffer and demand are highly variable in time and historically determined
Summary and Discussion • Time-evolution of the market share of products in the world trade has been studied by data analysis and model study • Urn model with quadratic preferential selection reproduces linear scaling of annual gain and loss of share and the power-law distribution of share with exponent 2 • The model represents the pressure of directing a country’s investment towards more popular products in the global economy • The quadratic preferential selection leads the world trade market to the edge of condensation • The condition for the emergence of pseudo condensate has been found. • The model explains the empirical observations very successfully at the aggregate level • The share trajectory of more than 60% products are predicted by the model capturing the pressure towards enhancing the likelihood of profit. • Nature of unpredictable products provides the reason of deviation from model prediction • For more realistic and predictive model, one should consider the network structure of product space– hopping in product space does not happen randomly but depending on the proximity of two products.