Understanding Data Analysis and Prediction Methods
190 likes | 294 Views
Learn about one-variable statistics, including types of variables, measures of center and spread, and how to describe data graphically and numerically. Practice creating frequency tables and histograms to analyze data distribution.

Understanding Data Analysis and Prediction Methods
E N D
Presentation Transcript
Two Main Uses of Statistics TO DESCRIBE (Data Analysis) TO PREDICT (Statistical Inference)
Definitions • Data: A collection of information in context. • Population: A set of individuals that we wish to describe and/or make predictions about. • Sample: A subset of the population that data is collected from. • Individual: Member of a population. • Variable: Characteristic recorded about each individual in a data set.
Types of Variables • Categorical Variable: A variable that records qualities or characteristics of an individual, such as gender or eye color. • Quantitative Variable:A variable that measures a characteristic of an individual, such as height, weight, or age. In this unit, we will focus on quantitative data.
Categorical or Quantitative Data? • Birth month • Number of siblings • Height in inches • Average amount of time (in minutes) of your ride to school. • Number of pets • Year & model of the car you drive • Age of your youngest parent • Predicted letter grade of your first Math 1 test.
1. Brand of vehicle purchased by a customer 2. Price of a CD 3. Number of students in a class of 30 who prefer peanut M&Ms over plain M&Ms 4. Phone number of all the students enrolled in school. 5. The height of a 1 year old child. 6. Number of students in a class of 35 who turn in a term paper before the due date. 7. Gender of the next baby born at a particular hospital. 8. Amount of fluid (oz) dispensed by a machine used to fill bottles with soda. 9. Thickness of the gelatin coating of a Vitamin C capsule 10. Brand of computer purchased by a customer 11. State of birth for someone born in the United States. 12. Price of a textbook 13. The phone numbers of everyone in this class. 14. Actual weight of coffee in a one pound can. 15. The length of a rattlesnake.
Describing Data Two ways to describe data: • Graphically • Numerically
Describing Data Graphically • Dotplot • Histogram • Boxplot
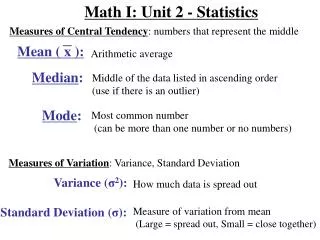
Describing Data Numerically • Measures of Center – mean, median • Measures of Spread – range, interquartile range, standard deviation
Measures of Center What is the typical value?
Measures of Spread How much do values typically vary from the center? • Range • Interquartile Range (IQR) • Standard Deviation
Common Core Math IUnit 2 Day 2Frequency Tables and Histograms
Link Up • Frequency Distribution Table • Histogram (by hand)
Describing Distributions • Shape • Center • Spread • Outliers
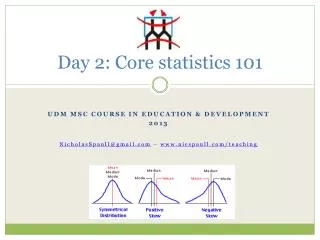
Shape • Mound shaped & symmetrical • Skewed left (extreme low values) • Skewed right (extreme high values) • Uniform
Center When describing a distribution at first, the center can be “eyeballed.” Remember, you are trying to answer the question: “What is the most typical value?”
Spread Range Remember, you are trying to answer the question: “How much do values typically vary from the center?” BE SURE TO STATE EVERYTHING IN CONTEXT!!
NFL Rushing Statistics Group activity: • Make a frequency distribution table for your assigned column of data. • Draw the corresponding histogram on graph paper. • Write a paragraph about your data that addresses shape, center, spread, and outliers.