Enhancing Airline Operations through Improved Weather Forecasting and Radar Technology
120 likes | 242 Views
This analysis explores the significant delays and costs incurred by airlines due to weather impacts, revealing 86.5 million delay minutes and $6.2 billion in direct operating costs. The discussion includes the role of primary players such as meteorologists, dispatchers, pilots, and controllers in managing weather hazards like turbulence and lightning. Calls for enhanced forecasting, tactical "now-casting," and automated reporting aim to improve safety, capacity, and operational efficiency. The potential benefits emphasize the need for integrated technology, policy support, and robust data collaboration among key stakeholders.

Enhancing Airline Operations through Improved Weather Forecasting and Radar Technology
E N D
Presentation Transcript
RADAR and Integration Bill Watts
Why - The Delay Cost - ATA numbers • 86.5 million delay minutes • $6.2 billion direct operating costs for airlines (exceeds projected 2005 industry losses!) • Social Productivity cost
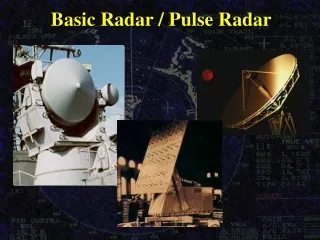
Weather Basics • Drivers – Safety, Capacity, Efficiency/Emissions • Primary Players - Meteorologist, Dispatcher, Pilot, & Controller • Hazards – Turbulence, Lightning, Ice, Ash • Solution Components • Forecast = BEFORE • Tactical/Now cast = DURING • Reporting = AFTER
Current State • Weather causes a significant % of delays • Weather impact - broadly defined • Confusion between Display and weather hazards • Radar Color vs. Hazard • Inferred vs. Measured hazards • Subjectivity • PIREPS (Wright Brothers) • Weather interpretation • Greater hazard is probably economic and passenger delays since Safety Rules
Background – NASA/NCAR • NASA/Delta Program • Enhanced Radar • Automated Turbulence Reports (Aircraft Response) • NCAR/DAL/UAL Program • Robust forecast (GTG) • NEXRAD Turbulence Detection Algorithm (NTDA) • Automated Turbulence Report (Atmospheric State)
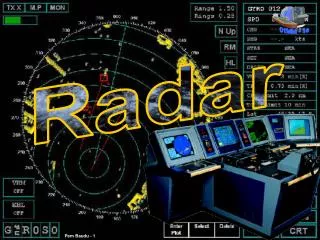
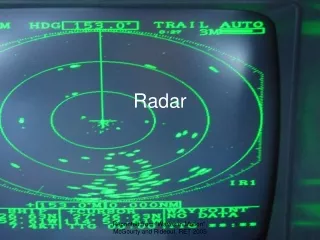
Initial E-Turb Display Two Levels of turbulence (magenta) • Light-Moderate (speckled) • Moderate + (solid)
System Goals • More & Better Data to drive enhancements in: • Safety • Capacity • Operational Efficiencies/Emissions • Leveraged technology • Recognize Limits of Current State - ATC chat room • Integrate the tools • Policies to support the goals
Potential Benefits • Safety • IF EVERYONE IS STRAPPED IN WITH CARTS STOWED, NO ONE GETS HURT. • KEY IS NOT TO CRY WOLF & F/A IGNORE WARNINGS • Efficiency/Emissions • Assumptions • Range of primary variables - %, Altitude, Time • Capacity – FAA FOCUS • Overall - The solutions for all 3 drivers might appear to conflict, but BETTER WEATHER KNOWLEDGE CAN DRIVE BETTER SOLUTIONS FOR ALL 3.
Solutions • Forecasting • Better forecasting models • NWS, NCAR, NOAA Coordination • “Now-Casting”/Tactical – 5-10 minutes • Better detection of hazards • Blended picture of hazards • Reporting • Standards • Data clarification • Blended solution - Sensors, Data link, & Displays
Future Path • Avoid Distractions • Airline priority of the day – Mergers, Fuel, Economy • FAA vs. Airline Goals • Employ Political Will • FAA – NextGen 4D Weather Cube • Airlines – Validate Benefits • Decide on Products & Data Handling • Airline, Government, Commercial or Mix • Cost burdens • Make a Decision–Champion Needed