Download
1 / 12
120 likes | 307 Views
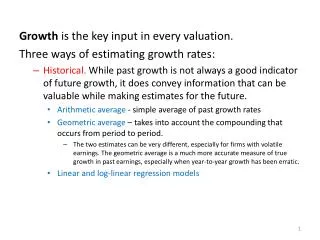
Growth is the key input in every valuation. Three ways of estimating growth rates: Historical. While past growth is not always a good indicator of future growth, it does convey information that can be valuable while making estimates for the future.

E N D
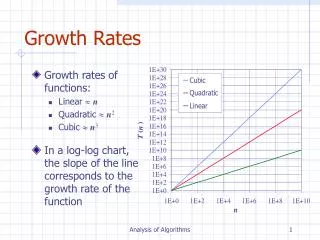
Growth is the key input in every valuation. Three ways of estimating growth rates: • Historical. While past growth is not always a good indicator of future growth, it does convey information that can be valuable while making estimates for the future. • Arithmetic average - simple average of past growth rates • Geometric average – takes into account the compounding that occurs from period to period. • The two estimates can be very different, especially for firms with volatile earnings. The geometric average is a much more accurate measure of true growth in past earnings, especially when year-to-year growth has been erratic. • Linear and log-linear regression models
Analyst estimates of growth. Analysts, in addition to using historical data can avail themselves of five other types of information that may be useful in predicting future growth: • Firm-specific information that has been made public since the last earnings report • Macroeconomic information that may impact future growth • Information revealed by competitors on future prospects • Private information about the firm • Public information other than earnings Analyst forecasts have been shown to be superior to historical growth rates in forecasting the next quarter forecast. However, in valuation, the focus is more on long-term growth rates. There is little evidence to suggest that analysts provide superior forecasts of earnings when the forecasts are over three-five years.
Fundamental growth rates. The third and soundest way of estimating growth is to base it on a firm’s fundamentals. Let’s first classify growth patterns into three categories: • Firms that are in stable growth already • Firms that expect to maintain a constant high growth rate for a period and then drop abruptly to stable growth • Firms that will have high growth for a specified period and then grow through a transition phase to reach stable growth at some point in the future It is important that as the growth rate changes, the firm’s risk and cash flow characteristics change as well. In general, as expected growth declines toward stable growth, firms should see their risk approach the average, and their reinvestment needs decline.
Length of high growth period Three factors to look at when considering how long a firm will be able to maintain high growth: • Size of the firm in relation to the market. • Smaller firms usually have more room to grow than larger firms. • When looking at the size of the firm, we should look not only at its current market share but also the potential growth in the total market for its products or services. • Existing growth rate and excess returns. • For example, a firm earning excess returns on its current investments is far more likely to have large positive excess returns on its marginal investments, and a long growth period, than a firm currently earning excess returns of 2%. • Magnitude and sustainability of competitive advantages. • This is perhaps the most critical determinant of the length of the high growth period. If there are significant barriers to entry and sustainable competitive advantages, firms can maintain high growth for longer periods. • The quality of existing management also influences our choices on growth.
Calculating growth rates We will focus on growth rates that we use with the dividend discount model (DDM), the free cash flows to equity model (FCFE), and the free cash flows to the firm (FCFF) model. • For the DDM: Expected growth rate = Retention ratio * ROE where
For the FCFE: Expected growth in net income = Equity reinvestment rate * ROE where • For the FCFF: Expected growth in EBIT = Reinvestment rate * Return on capital (ROC) where
Stable growth • As a firm grows, it becomes more difficult for it to maintain high growth and it will eventually grow at a rate less than or equal to the growth rate of the economy in which it operates. This growth rate, called stable growth, can be sustained in perpetuity, allowing us to estimate the value of all cash flows beyond that point as a terminal value for a going concern. • Since no firm can grow forever at a rate higher than the growth rate of the economy in which it operates, the constant growth rate cannot be greater than the overall growth rate of the economy. • The stable growth rate can be lower than the overall growth of the economy. There is nothing that prevents us from assuming that mature firms will become a smaller part of the economy. This may, in fact, be the more reasonable assumption to make since the overall growth rate of the economy reflects the contributions of young, high growth firms, and mature stable growth firms. If the former grow at a faster rate than the economy, then the latter have to grow at a lower rate.
In making a judgment of what stable growth for a company should be, we have to consider the following questions: • Is the company constrained to operate as a domestic company, or does it operate (or have the capacity to operate) multinationally? • Companies operating domestically are constrained by the growth rate of the domestic economy. • Multinational companies are constrained by the growth rate of the global economy, or at least those parts of the globe that the firm operates in. • Is the valuation being done in nominal or real terms? • If the valuation is a nominal valuation, the stable growth rate should also be a nominal growth rate. (note: we are doing nominal valuations in class) • What currency is being used to estimate cash flows and discount rates in the valuation? • If a high-inflation currency is used to estimate cash flows and discount rates, the stable growth rate will be much higher, since the expected inflation rate is added on to real growth.
Betas, Reinvestment and Retention ratios • As firms become more mature, they tend to approach the riskiness of the market portfolio, i.e., their betas tend to get closer to one, and the cost of equity has to be recalculated to reflect the changing beta of the firm. • Stable growth firms tend to reinvest less than high-growth firms, and it is critical that we capture the effects of lower growth on reinvestment and that we ensure that the firm reinvests enough to sustain its stable growth rate in the terminal phase.
For the DDM, this is calculated as Retention ratio = Expected growth rate/ROE • For the FCFE model, this is calculated as Equity reinvestment rate = Expected growth rate/ROE • For the FCFE model, this is calculated as Reinvestment rate = Expected growth rate/ROC
Putting it all together • The first decision we have to make is figuring out what the high growth rate is, and how long the high growth period is going to be. • The next step is to decide what the stable growth rate is, and calculate the implied reinvestment rate from this. • And, finally, we have to think about how the firm will make the transition from high growth to stable growth. In general, you can think of the following scenarios: • Two-stage model: the firm will be in high growth for some time and transition to stable growth abruptly. This model is more appropriate for firms with moderate growth rates where the shift will not be too dramatic. • Three-stage model: the firm will be in high growth, followed by a transition phase where the growth rate slowly decreases to reach the stable growth rate. This is more appropriate for firms with very high growth rates where the transition phase allows for a more gradual adjustment to stable growth. • N-stage model: the firm’s characteristics, and therefore growth rate, can change from year to year, until it reaches the stable growth period. This is more appropriate for young firms or for firms with negative earnings. • Or, it is also possible that your firm is already in stable growth.
Sources: • Damodaran, Investment Valuation, 2nd ed. • McKinsey & Company, Koller, Goedhardt, and Wessels, Valuation: Measuring and managing the value of companies, 5th ed.