Download
1 / 21
210 likes | 217 Views
Explore insights on the 2010 Atlantic hurricane season, including historical activity, SST anomalies, wind shear patterns, and atmospheric anomalies. Learn about the conditions that influenced the season and the impact of key climate factors like La Niña and the Tropical Multi-Decadal Signal.

E N D
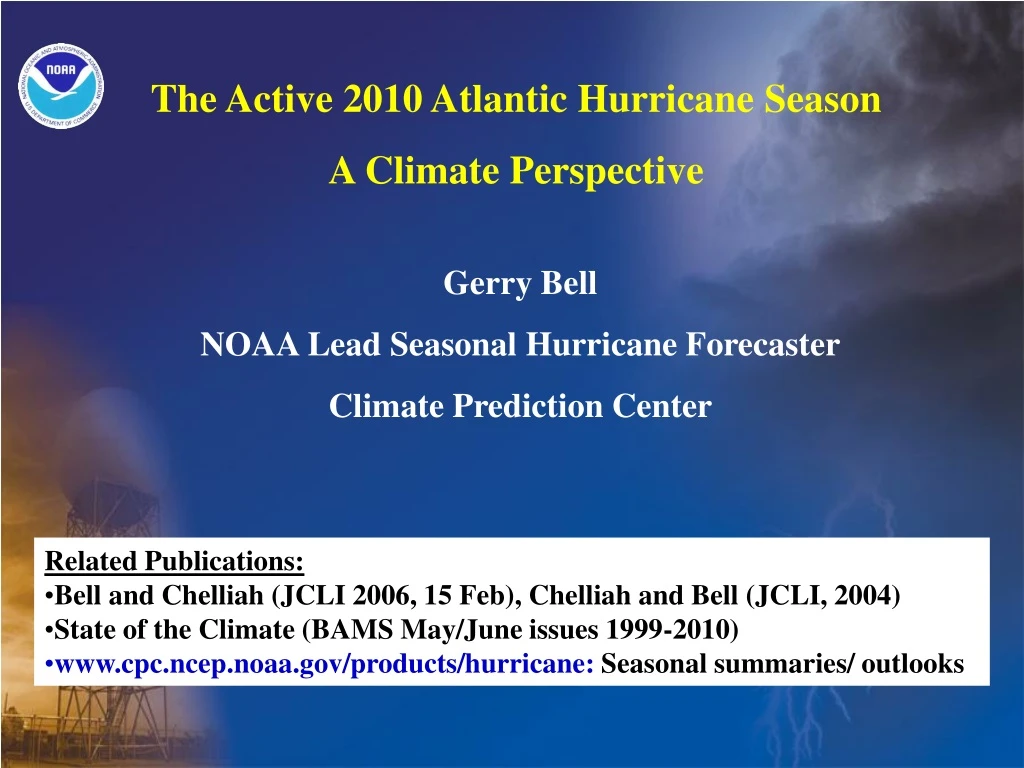
The Active 2010 Atlantic Hurricane Season A Climate Perspective Gerry Bell NOAA Lead Seasonal Hurricane Forecaster Climate Prediction Center • Related Publications: • Bell and Chelliah (JCLI 2006, 15 Feb), Chelliah and Bell (JCLI, 2004) • State of the Climate (BAMS May/June issues 1999-2010) • www.cpc.ncep.noaa.gov/products/hurricane: Seasonal summaries/ outlooks
2010 Atlantic Named Storms Main Development Region (MDR) To Date Named Storms: 19 Hurricanes: 12 Major Hurricanes: 5 ACE (% Median): 190 Graphic from Weather.Unisys.com
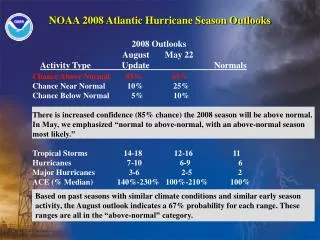
NOAA’s 2010 Atlantic Hurricane Season Outlooks Above Normal Season90% Chance Above Normal Season85% Chance Near Normal10% Near Normal10% BelowNormal5% Issued 27 May Issued 5 August 70% Probability for Each Outlook Range May Outlook August Outlook To Date ACE (% Median): 155%-270% 170%-260% 190% Named Storms: 14-23 14-20 19 Hurricanes: 8-14 8-12 12 Major Hurricanes: 3-7 4-6 5
Historical Atlantic Seasonal Activity • ACE: Wind energy index measures seasonal activity (intensity and duration) • ACE=∑ ∑ Vmax2for all named storms while at least TS strength (4x daily) • 1995-2010 (16 seasons): 11 above normal (69%), 2 below normal (12.5%) • 1971-1994 (24 seasons): 3 above normal (12.5%), 12 below normal (50%) NS T
Conditions Associated with the 2010 Atlantic Hurricane Season
Atlantic SST Anomalies (oC) (Top) ERSST-V3b SST anomalies (°C) during Aug-Oct 2010. (Bottom) Consecutive Aug-Oct area-averaged SST anomalies in the MDR. Red line shows the corresponding 5-yr running mean. Green box in (a) denotes the MDR. Anomalies are departures from the 1971-2000 period monthly means. The ASO 2010 SST anomaly in MDR (green box, top panel) was +0.91C. The previous ASO record anomaly was +0.77C set in 2005.
ASO 2010: 200-850 hPa Vertical Wind ShearMagnitude and Vector Weak vertical wind shear (Red) across MDR. 3-celled anomaly pattern reflects extensive anomalous easterly shear vector. Aug-Oct 2010: 200-850 hPa vertical wind shear magnitude (m s-1) and vectors (Top) total and (Bottom) anomalies. In (a), shading indicates values below 8 ms-1. In (b), red (blue) shading indicates below- (above-) average magnitude of the vertical shear. Green box denotes the MDR. Anomalies are departures from the 1971-2000 period monthly means.
ASO 2010 Climo Vertical profile of area-averaged winds over the Caribbean Sea (90W-60W, 10N-20N):(Left) Zonal wind and (Right) Omega- vertical motion. Climatologies are the 1971-2000 period means.
Conditions During 2010 Atlantic Hurricane Season • Inter-related set of atmospheric anomalies typifies seasons within Atlantic high activity era • Opposite atmospheric anomalies during low activity era.
Shading indicates height anomalies • Mean African Easterly Jet (AEJ) is farther north, Cyclonic anomaly spans MDR. • Deep layer of anomalous inflow with enhanced West African Monsoon • AEJ location and structure is more conducive to amplification of African easterly waves—Linear barotropic and baroclinic instability. Shading indicates anomalous cyclonic relative vorticity ASO 2010: (Top) 1000-hPa anomalous height and vector wind (m s-1 ). (Middle) 700-hPa anomalous cyclonic relative vorticity (shading) and vector wind, with thick solid line indicating the observed AEJ axis. (Bottom) 200-hPa anomalous wind vector and speed. Green boxes denote the MDR. Anomalies are departures from the 1971-2000 period monthly means.
Observations • 1. Active (and inactive) Atlantic hurricane seasons and decades are not random. They reflect a coherent set of atmospheric and oceanic anomalies. • 2. The leading modes of tropical convective variability (ENSO and tropical multi-decadal signal) represent a dominant forcing of these coherent atmospheric anomalies (Bell and Chelliah 2006). • 3. Many of the regional conditions that determine hurricane season strength reflect varying combinations of these leading convective modes. • 4. Key features of the 2010 Atlantic hurricane season can be interpreted as a response to the combination of La Niña, the ongoing active Atlantic phase of the tropical multi-decadal signal, and record warm Atlantic SSTs.
La Niña 200-hPa Velocity Potential Anomalies: 5N-5S -15 -12 -9 -6 -3 0 3 6 9 12 15 La Niña signal present since mid-June.
Aug-Oct Tropical Multi-Decadal SignalPhase shown for Active Atlantic Hurricane Era Warmer Warmer Wetter Drier • EOF analysis applied to 5-yr running means of seasonal 200-hPa velocity potential anomalies (From Bell and Chelliah, JCLI 2006). • Links multi-decadal fluctuations in West African monsoon system with the Atlantic Multi-Decadal Oscillation (AMO) (Bell and Chelliah 2006).
ASO: LP-Filtered (5-year) Explained Variance (%) associated with Tropical Multi-Decadal Signal MDR Amplified Ridges Easterly Wind Anom. Westerly Wind Anom. Easterly Shear Anom. West African monsoon variability is associated with significant changes in atmosphere’s kinematic, dynamic, and thermodynamic properties within the MDR, thus strongly influencing Atlantic hurricane activity on seasonal and decadal time scales.
200-hPa Anomaly Velocity Potential and Divergent Wind Vector Tropical multi-decadal signal La Niña ASO 2010 Anomalies Aug-Oct: 1995-2009 minus 1971-1994 2010 anomalies consistent with high activity era and are opposite to low activity era.
200-hPa Streamfunction Anomalies ASO 2010 ASO Regressed: Tropical multi-decadal signal + La Niña Tropical multi-decadal signal La Niña ASO: 1995-2009 minus 1971-1994
Time series showing consecutive Aug-Oct values of area-averaged (a) 200-850 hPa vertical shear of the zonal wind (m s-1), (b) 700-hPa zonal wind (m s-1) and (c) 700-Pa relative vorticity (x 10-6 s-1). Blue curve shows unsmoothed values, and red curve shows a 5-pt running mean of the time series. Averaging regions are shown in the insets.
Summary Inter-related set of atmospheric conditions during 2010 is consistent with leading tropical convective modes: Tropical multi-decadal signal and La Niña—along with record warm Atlantic SSTs. Also consistent with Atlantic high activity era. I see no indication of a demise in the coherent and inter-related set of conditions which have contributed to the high activity era Modeling Implications 1. Correct model simulations of 2010 season, and of the observed decades-long fluctuations in Atlantic hurricane activity, will require accurate representations of key atmospheric wind and pressure patterns that are intrinsically linked to west African monsoon variability. 2. Observations do not justify expectations that climate models which fail to reproduce the observed west African monsoon variability can provide meaningful guidance regarding future Atlantic hurricane activity.
Atlantic SST Anomalies (oC) Monthly SST Departures in MDR MDR Mar-Aug SST Departures in MDR March-August 2010: Record warm SSTs in Main Development Region (+ 1.16oC). ERSST V.3b data. Climo is 1971-2000.
200-850 hPa Vertical Wind ShearMagnitude and Vector 1995-2009 minus 1971-1994 3-celled pattern of anomalous shear typifies Atlantic high activity era and East Pac. low activity era.