Download

1 / 50
530 likes | 863 Views
I.2- Laser- Assisted Machining ) cutting of material (.

E N D
I.2- Laser- AssistedMachining )cutting of material( One of the problems associated with conventional approaches to the cutting of especially tough materials such as titanium alloy is that at high cutting speeds the life of the cutting tool is very short. Since these materials are used extensively in the aerospace industry there is much interest in techniques that enable the cutting rates to be speeded up.
One possibility is laser assisted machining. During cutting a high-power laser beam is focused onto the work surface just ahead of the cutting tool. The material is softened and hence more readily removed. Because only a small area is heated the cutting tool remains relatively cool. Thus higher cutting rates become possible or alternatively longer tool life can be achieved for a given cutting speed. To reduce the natural reflectance of the metal surface an absorptive coating may be sprayed on just ahead of the laser beam.
I.3- Holography INTRODUCTION Holography is a technique which, in some respects, is similar to photography. In conventional photography we record the two-dimensional irradiance distribution of the image of an ‘object scene’, which may be regarded as consisting of a large number of reflecting or radiating points The waves from these points all contribute to a complex resultant wave, which we call the object wave. This wave is then transformed by a lens into an image of the object which is recorded in photographic emulsion.
In holography, on the other hand, we record the object wave itself rather than the image of the object. The object wave is recorded in such a way that on subsequently illuminating the record the original object wave front is reconstructed, even in the absence of the original object. Holography, in fact, is often referred to as wave front reconstruction. Visual observation of the reconstructed wave front gives a view of the object which is indistinguishable from the original object. That is, the image generated in holography possesses the depth and parallax properties normally associated with real objects.
The fundamental difference between photography and holography is that in photography we record only the amplitude of the resultant wave from the object (strictly speaking the photographic plate records irradiance, which is proportional to the square of the amplitude), while in holography we record both the amplitude and phase of the wave. We may see, in simple terms, how this is achieved, as follows.
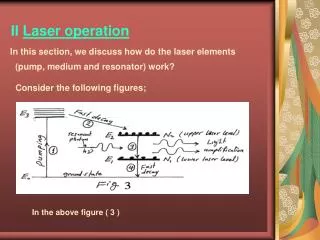
To record the phase of the object wave we use a beam of mono chromatic light originating from a small source so that the light is coherent. By this we mean that the temporal and spatial variations of the phase of the light beam are regular and predictable. If light beams are coherent then interference effects which are stable in time can be obtained. The monochromatic beam is split into two parts, as illustrated in Fig. (1), one of which is used to illuminate the object, while the other, which we call the reference wave, is directed towards a photographic plate. The light directed towards the object is scattered and some of it, the object wave, also falls on the photographic plate. If the original monochromatic light has a sufficiently high degree of coherence, then the reference and object waves will be mutually coherent and will form a stable interference pattern in the photographic emulsion
The interference pattern, in general, is a complicated system of interference fringes due to the range of amplitudes and phases of the various components of the light scattered from the object. This interference pattern, which is unique to a particular object, is stored in the photographic emulsion when the plate is developed. This record is called a hologram. The hologram consists of a complicated distribution of clear and opaque areas corresponding to dark and bright interference fringes. When it is illuminated with a beam of light similar to the original reference wave, as shown in Fig. (1),
Fig. (1) A typical holographic arrangement: (a) making the hologram by recording the interference pattern produced by the interference of the reference and object wavefronts; (b) reconstruction of the object wavefront. The reconstruction produces two images, a virtual (orthoscopic) image and a real (pseudoscopic) image.
In parallel with the advances in the optical arrangements for holography improved photosensitive materials for recording the hologram have been introduced. These need to have a high resolution with the grain size less than about 50 nm as the interference fringes are typically one wavelength apart. In addition, for some purposes, the photosensitivity should be high to reduce exposure times, though the high irradiance available from lasers often compensates for this. Thus, while the high sensitivity of silver-halide emulsion makes it attractive in some applications, the greater resolution obtainable in other materials, such as dichromated gelatin films, is an advantage in others
I.3.1- Holographic Interferometry Applications of holography Holographic interferometry is an extension of the interferometric techniques The unique advantage of holographic interferometry is that the hologram stores the object wavefront for reconstruction at a later time. Thus it enables wavefronts which are separated in time or space, or even wavefronts formed by light of different wavelengths to be compared. Holographic interferometry is commonly divided into a number of classes which we shall now describe.
I.3.1.1-Double exposure holographic interferometry This technique, which is widely used in industry, enables very small displacements or distortions of an object to be measured. First of all the object under investigation is recorded as a hologram. Then, before the photographic plate is developed, the object is subjected to stress, moved slightly or whatever and a second exposure is made on the same plate. When the processed plate is illuminated with the original reference beam
Fig. 2 A double exposure holographic interferogram showing the deformation of a circular membrane which has been deformed by uniform pressure. (Photograph courtesy of W. Braga and C. M. Vest, The University of Michigan)
two images are reconstructed, one corresponding to the unstressed object, the other to the object in its stressed or displaced state. Thus two sets of light waves reach the observer. These can interfere in the normal way so that the observer sees (an image of) the object covered with a pattern of interference fringes. This pattern is essentially a contour map of the change in shape of the object. A photograph of the fringe pattern produced by a typical double-exposure hologram is shown in Fig. 2. A limitation of the technique is that information on intermediate states of the object as it is stressed is not recorded, rather only the stressed state at the time of the second exposure. This limitation can be overcome by producing either sandwich holograms or by using real-time holography.
I.3.1.2-Sandwich holograms In sandwich holography as shown in Fig. (3), pairs of photographic plates NF are exposed simultaneously. N1F1 are exposed to the unstressed object, while N2F2, N3F3 ... are exposed with the object increasingly stressed. After all of the plates have been processed, F1 is combined with, for example, N2 in the original plate holder and illuminated with the original reference beam to produce an interference pattern corresponding to the deformation resulting from the loading at the time of exposure of N2. Various combinations F1N2, F2N3, F3N4, ... will enable incremental deformations to be analyzed.
Fig.3 Diagram showing the principles of sandwich holograph and illustrates how the deformation of an object may be determined from the fringe patterns produced by a simultaneous reconstruction of holograms produced at different stages in the deformation of the object;
I.4-The optical fiber The idea that a light beam could be carried down a dielectric cylinder is not new. In 1870 Tyndall demonstrated the guiding of light within a jet of water. However, the idea was not pursued very far since it was known that the light penetrates a little way into the medium surrounding the cylinder. This causes losses to be high and makes handling the cylinder difficult. In 1954, however the idea of a cladded optical waveguide was put forward and the optical fiber as we know it today was born. One of the initial difficulties was that the fiber showed very high attenuation, typically 1000 dB km-1.
The units used here for attenuation require a little explanation. Suppose a beam of power Pi is launched into one end of an optical fiber and that the power remaining after a length L km is Pf. The attenuation (dB km-1) is then given by dB km (1) Attenuation =
Fig. 1 Refractive index profile for a step-index fiber. Originally most of the high attenuation was due to the presence of impurities in the fiber. Improved manufacturing techniques have made it possible to reduce the attenuation to values below 1 dB km-1.
The simplest type of optical fiber is the step-index fiber, where variation with refractive index with distance away from the center is as shown in Fig. (1). The central region is known as the core and the surrounding region the cladding. Usually the core and cladding refractive indices differ by only a few percent. Typical dimensions for such a fiber are a core diameter of 200 mm with a combined core and cladding diameter of 250 mm. When made from glass or silica the fiber is reasonably flexible and fairly strong. It is common practice though to coat the outside of the fiber with a layer of plastic which protects the fiber from physical damage and helps preserve its strength.
To see how light can be guided down such a structure, consider a beam of light which passes through the center of the fiber core and strikes the normal to the core-cladding interface at an angle qc ( Fig. 2). Because the cladding has a lower refractive Fig 2 the Zig-Zig path of a meridonal light ray down an optical fiber: this occurs when the angle of incidence at the interface , q, is greater than the angle , qc
Fig. 3 The path of a skew ray in a circular step-index fiber seen in a projection normal to the fiber axis. index than the core, total internal reflection can take place provided that the angle is greater than the critical angle c where qc= sin-1(n2/n1) (2)
Total internal reflection implies that the core-cladding interface acts as a ‘perfect’ mirror. Thus when q > qc the ray will travel down the fiber in a zig-zag path. Because such a ray keeps passing through the center of the fiber it is known as a meridional ray. Other guided rays are possible which do not pass through the center. These are known as skew rays, and they describe angular helices as sketched in Fig. 3. Let us now examine what happens to a meridional ray when it leaves the fiber. Assuming the external medium to have a refractive index of no (usually n0 = 1 of course if the fiber is in air), from Fig. 3 we see that, by Snell’s law, the angle a that the ray outside the fiber makes with the normal to the fiber end is given by
Hence sin a = (n1/no)cos Since q must always be greater than qc the maximum value, a max, that a can take is given by = n0 sin a max = n1 cos qc = n1 ( 1- sin2qc) 1/2 =
Fig. 3 Illustrating the path of a meridional ray as it enters a circular step-index waveguide. The ray is incident on the end of the fiber at an angle a to the normal. Inside the waveguide the ray makes an angle i with the normal to the guide axis. The quantity is known as the numerical aperture (NA) of the fiber and hence a max = sin-1 (NA/no) (3)
As well as representing the maximum angle at which light can emerge from a fiber amax also represents the largest angle which light can have and still enter the fiber. Consequently amax is known as the fiber acceptance angle (sometimes 2 amax is used and is called the total acceptance angle).
II.1.1-Graded-index fiber Graded index fiber, as its name suggests, has a variation in refractive index across its core. This variation is often expressed in the form r where = (n1- n2) / n1. Thus n1 is the axial refractive index while n2 is related to (but does not exactly equal) the cladding index. The parameter y (the profile parameter) determines the shape of the refractive index profile. A typical refractive index profile is shown in Fig. 4.
Graded-index fibers have somewhat smaller cores than step-index fibers, usually 50 mm diameter, with a combined core and cladding diameter of 125 mm. We may distinguish between three different types of ray path in graded index fibers, as illustrated in Fig. 5, namely the central ray, the meridional rays and the helical rays. In the latter two cases the rays follow smooth curves rather than the zig-zags of step-index fibers. These diagrams enable us to appreciate why intermodal dispersion is smaller than in step-index fibers. A helical ray, for example, although traversing a much longer path
Fig. 4 Refractive index profile for a graded-index fiber. Fig. 5 Ray paths in a graded-index fiber. We may distinguish between (a) a central ray, (b) a meridional ray and (c) a helical rayavoiding the center.
than the central ray, does so in a region where the refractive index is less and hence the velocity greater. To a certain extent the effects of these two factors can be made to cancel out, resulting in very similar propagation velocities down the fibers for the two types of ray. Similar arguments apply to the meridional rays. The amount of intermodal dispersion is dependent on the factor in Eq. (4); it is smallest when is slightly less than 2. Graded-index fibers have been made with bandwidth-distance products as high as 2 GHz km. The number of guided modes within a graded-index fiber with = 2 is one half of that for a comparable step-index fiber, which means that under the same excitation conditions it will only carry half the energy.
II.1.2-Fiber materials and manufacture Only two main types of material have been seriously considered to date for use in optical waveguides, these being plastics and glasses. Plastic fibers offer some advantages in terms of cost and ease of manufacture, but their high transmission losses preclude their use in anything other than short- distance optical links (that is, less than a few hundred meters).
GLASS FIBERS. A broad distinction may be made between glasses based on pure Si0 and those derived from low softening point glasses such as the sodium borosilicate, sodium calcium silicates and lead silicates. For convenience we shall refer to these as silica fibers and glass fibers respectively. An obvious requirement of the material used is that it must be possible to vary the refractive index. Pure silica has a refractive index of 1.45 at 1mm and B2O3 can be used to lower the refractive index, whilst other additives such as GeO2 raise it. Thus a typical fiber may consist of an SiO2 : GeO2 core with a pure Si0 cladding. Glass fibers can be made with a wide range of refractive index variation but control of the impurity content is more difficult than with silica.
At present there are two main techniques for manufacturing low-loss fibers, these being the double crucible method and chemical vapor deposition (CVD). The apparatus for the former technique is illustrated in Fig. 6 Pure glass, usually in the form of rods, is fed into two platinum crucibles. At the bottom of each crucible is a circular nozzle, that of the inner vessel being concentric with that of the outer and slightly above it. The inner crucible contains the core material, the outer that of the cladding. When the temperature of the apparatus is raised sufficiently, by using an external furnace, the core material flows through the inner nozzle into the center of the flow stream from the outer crucible. Below the crucibles is a rotating drum and the composite glass in the form of a fiber is wound onto it.
Fig. 6 Schematic diagram of fiber-drawing apparatus using the double- crucible technique. Omitted for clarity is the furnace surrounding the double crucibles. It is customary, immediately the fiber is formed, to give it a protective coating of plastic by passing it through a bath of molten plastic and a curing oven.
If the two types of glass remain separate, then a step-index fiber will result. However, by using glasses that inter-diffuse (or by having dopants which do so) then graded-index fibers can be obtained. One problem with this approach is that the index profile will be determined by diffusion processes and these are usually difficult to control accurately. The resulting fibers, though, will almost certainly have smaller intermodal dispersion than step-index fibers.
In the modified chemical vapor deposition (MCVD) method, a doped silica layer is deposited onto the inner surface of a pure silica tube. The deposition occurs as a result of a chemical reaction taking place between the vapor constituents that are being passed down the tube. Typical vapors used are SiCl4 GeCl4 and O2, and the reactions that take place may be written SiCl4 + O2 SiO2 + 2C12 and GeC l4 + O2 GeO2 + 2C12
The zone where the reaction takes place is moved along the tube by locally heating the tube to a temperature in the range 1200-1600°C with a traversing oxy-hydrogen flame (Fig. 7). If the process is repeated with different input concentrations of the dopant vapors, then layers of different impurity concentrations may be built up sequentially. This technique thus allows a much greater control over the index profile than does the double crucible method. Once the deposition process is complete, the tube is collapsed down to a solid preform by heating the tube to its softening temperature ( 2000C )
Surface tension effects then causes the tube to collapse into a solid rod. A fiber may be subsequently produced by drawing from the heated tip of the preform as it is lowered into a furnace (Fig. 8). To exercise tight control over the fiber diameter a thickness monitoring gauge is used before the fiber is drawn Onto the take-up drum, and feedback applied to the drum take-up speed. In addition, a protective plastic coating is often applied to the outside of the fiber by passing it through a bath of the plastic material; the resulting coating is then cured by passing it through a further furnace.
The MCVD technique is capable of producing extremely low-loss fiber, mainly because of the high degree of control on impurity content. The double crucible technique is not as successful from this point of view, however, it is simpler and cheaper to implement. PLASTIC FIBERS. Other types of fiber are possible using plastics. For example, fibers can be made with silica cores and plastic claddings. These are easy to manufacture; the fiber core may simply be drawn through a bath of a suitable polymer which is subsequently cured by heating to a higher temperature to provide a solid cladding. This process readily lends itself to
Fig. 7 Production of fiber preform by modified chemical vapor deposition. In the first stage, (a), the reactants are introduced into one end of a silica tube and the core material deposited on the inside of the tube in the reaction zone where the n is maintained at about 1600°C. Several traverses heating assembly may be necessary to build up sufficient thickness of core material. In the second stage, (b), the tube is into a solid preform rod by heating to the silica-so fling temperature (about 2000° Cl).
the production of step-index fibers with large core diameters where very little of the energy carried in the cladding. Such fibers are attractive for short-distance, low-bandwidth communication systems, where cost is a major consider3.t1 Typical losses are of the order of 10 dB km-1 . Fibers can also be made entirely from plastics but these suffer from very high attenuations, mainly because of a large Rayleigh scattering contribution. Such fibers are only of any practical use in the visible region of the spectrum, preferably around 600-700 nm, and then only for short-distance, low-bandwidth systems. Since plastic is an inherently more flexible material than glass, plastic fibers can be made with larger diameters (up to a millimeter or so).
Fig. 8. Fiber drawing starting from a solid preform rod. The stages after and including the plastic coating bath are identical to the corresponding stages of the double-crucible technique.
II.2- OPTICAL DISK SYSTEMS In recent years optical disks have been used increasingly for entertainment, educational programs and general audio-visual communications. In the field of data storage direct optical recording systems are becoming popular as computer peripherals, where the combination of very high information capacity and rapid random access makes optical disks an attractive alternative to other forms of computer memory store. The high information capacity, long shelf life and long storage life are leading to applications in archival storage.
In all the optical disk systems, such as prerecorded audio disks (compact disk or CD), video disks (often called laser vision or LV) and data-storage disks, we shall assume that the information is recorded or written onto the disk and played back or read optically. In practice a variety of lasers such as argon ion, HeNe, HeCd, and A1Ga As semi-conducting laser diodes have been used as the light sources for writing and reading. There are, in fact, alternative methods of writing the disk - for example electromechanical cutting - and also for reading it - for example capacitative pick-up. We shall not, however, consider these further.
The main advantage of optical disks over other systems such as conventional audio disks and magnetic tape systems, apart from the high storage density is: 1- The absence of physical contact between the reading head and the information storage medium, which prevents wear. 2- Furthermore, in the case of an optical disk a transparent film may be deposited over the information stored to protect it from damage.
As with conventional audio gramophone records the information is stored in a spiral, called the track, on the surface of the recording disk. In practice with optical disks, however, there is often neither a groove nor indeed a continuous line present but only marks forming a broken spiral line. These marks are small areas giving an optical contrast with respect to the surroundings. They are most commonly depressions or pits formed in the surface of the disk ( See Fig. 1). As a consequence the reflectance will change along the track according to the distribution of the pits, which represents the information stored.
To read the stored information an optical pick-up converts the variations in reflectance into an electronic signal. A lens within the pick-up focuses a low-power laser beam to a small spot of light on the track and also redirects the light reflected from the disk to a photodetector (Fig. 2). The output of the photodetector varies according to the distribution of pits along the track and gives an electrical signal which enables the original audio, video or data signal to be regained.
Audio signals are stored digitally on the disk. Sound samples are taken at the rate of 44.1 kHz and the sound level of each sample is converted into a numerical value which is represented in a binary codeword of 16 bits. Additional bits for error correction are then added and a bit stream at 4.3218 MHz is stored on the disk. ‘Zeros’ are represented by a low photosignal and ‘ones’ by a high-level photosignal, so the track will consist of pits and spaces of discrete lengths. Video signals, on the other hand, are stored in analog form because digital storage requires too high a bandwidth.
The composite video signal (with color and irradiance information) is frequency modulated (FM) around a carrier frequency of 7.5 MHz and sound added as a duty cycle modulation. This causes the center-to-center distance of the pits to vary according to the FM content and the ratio of pit length to space length to vary according to the sound content. In optical memories data is stored in both analog and digital form and while initially the disks were nonerasable progress is being made in the field of erasable storage media (see Fig. 1). To be useful in electronic data processing a storage peripheral must be capable of retrieving stored data with a final error rate of the order of 1 in 1012; optical disks have met this requirement.
Fig. 1 (a) Schematic of a typical optical disk. The precise ‘geometry’ of a pit depends on a number of factors including the storage mode and readout technique employed. (b) Scanning electron micrograph of an optical disk (From G. Bouwhuis. A. Huijser, J. Pasman, G. Von Rosmalen, K. Schouharner Immink, Principles of Optical Disc Systems (1985). Courtesy Adam Huger Ltd).
Fig.2 The basis of readout from an optical disk. The read beam from a laser is focused onto the surface containing the pits. Particles of dust on the protective layer are not in focus and do not affect the readout process.