Download
1 / 26
270 likes | 426 Views
Leading the Blue Revolution May 2014 Marine Harvest - Henrik Heiberg. Forward looking statements.

E N D
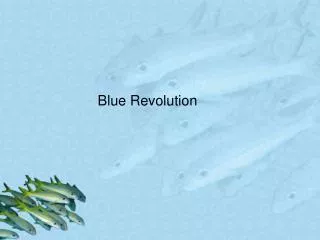
Leading the Blue RevolutionMay 2014Marine Harvest - Henrik Heiberg
Forward looking statements This presentation may be deemed to include forward-looking statements, such as statements that relate to Marine Harvest’s contracted volumes, goals and strategies, including strategic focus areas, salmon prices, ability to increase or vary harvest volume, production capacity, expectations of the completion and capacity of our fish feed plant, trends in the seafood industry, including industry supply outlook, exchange rate and interest rate hedging policies and fluctuations, dividend policy and guidance, asset base investments, capital expenditures and net working capital guidance, NIBD target, cash flow guidance and financing update, guidance on financial commitments and cost of debt and various other matters (including developments with respect to laws, regulations and governmental policies regulating the industry and changes in accounting policies, standards and interpretations) on Marine Harvest's business and results. These statements speak of Marine Harvest’s plans, goals, targets, strategies, beliefs, and expectations, and refer to estimates or use similar terms. Actual results could differ materially from those indicated by these statements because the realization of those results is subject to many risks and uncertainties. Our registration statement on Form 20-F filed with the US Securities and Exchange Commission in 2014 contain information about specific factors that could cause actual results to differ, and you are urged to read them. Marine Harvest disclaims any continuing accuracy of the information provided in this presentation after today.
Implied protein consumption driven by population growth only Assumption: Constant consumption of protein per capita Sources: FAO (2009); FAOstat Food Balance Sheets, United Nations population data; World PopulationProspects: the 2012 Revision
Farmed Atlantic salmon relatively small Atlanticsalmon Sources: OECD-FAO Agricultural Outlook 2013 Kontali Analyse
Large opportunities within aquaculture species Note: SizeofcirclesindicatesharvestvolumeSource: Kontali Analyse
A uniquenutritionalpackage Proteins: Omega-3: Vitamins: Mineral: High quality, easydigestable proteins High contentof Omega-3 fatty acids Rich in A, D og B12 vitamins High contentofiodine & selen, taurin og sterols
Farmed salmon - Highly efficient use of resources Notes: (1) FCR ofcattlevariesbetween 4.2 and 9.8 dependingonfeed (finishedon cereal or grass). (2) Carbonequivalent per kg of edible product Sources: Ytrestøyl et. al. (2014), NationlBeef Association UK (2014), Volden, H and N. I. Nielsen, (2011) Energy and metabolizable protein supply, Skretting (2012) DeliveringSUSTAINABLE FEED SOLUTIONS for aquaculture, SINTEF Report (2009) CarbonFootprint and energyuseof Norwegian seafoodproducts
Farmed Atlantic salmon by market Source: Kontali Analyse
Historic price–volume relationship • Both 2012 and 2013 clear outliers compared to historical relationship Source: Kontali Analyse
Estimates of the market for farmed Atlantic salmon Source: Kontali Analyse
Historical price development Note: Reference price in Oslo
Current licensing regime in Norway Source: Kontali Analyse
We own ~25% of the global production capacity! Marine Harvest business areas Bilder Bilder New #1 #1 220 thousand tonnes vs. global production of ~2.6m 405 thousand tonnes vs. global production of c.1.85m (22%) Position: Global sales network Leading position in VAP Focus areas: Integration of Morpol Restructuring programme in VAP Organic growth in VAP Successful construction and implementation by June/July 2014 Acquisitive growth in Norway and Chile
Fish feed project proceeding according to plan • 220 thousand tonnes capacity – 60% of MHG requirement in Norway(1) • ~NOK 800m investment - Completion June/July 2014 Notes: (1) Based on 2014 harvest volume estimate
Marine Harvest farming regions Norway Region North Volume: 61 000 Norway Region Mid Volume: 63 000 Faroe IslandsVolume: 9 000 CanadaVolume: 29 000 Norway Region West Volume: 84 000 ScotlandVolume: 49 500 Norway Region South Volume: 56 000 IrelandVolume: 6 000 ChileVolume: 59 500 MH harvestvolume 2014E (tonnes HOG)
Marine Harvest’s Sales & Marketingnetwork Scotland Norway Canada Poland Ireland The Czech Republic China The Netherlands France Japan Italy South Korea Belgium Spain Taiwan Hong Kong USA Singapore Chile Asia Head office Primary and secondary processing Feed factory Sales Significant consumer good processing assets in Europe, US and Asia Note: All figuresarevolumeguidance for 2014 (except VAP Europe which is the 2013 figure). Actualharvestvolumeswill be affected by e.g. water temperatures, development in biologicalgrowth, biologicalchallengessuch as diseases, algeablooms etc. and marketdevelopments.
Morpol – acquired in 2013 • Major step in becoming a leading integrated protein player • The leading secondary processing entity in Europe • Complementary market position to Marine Harvest • ~About 4,000 employees
Industry supply outlook Actual harvest volumes will be affected by e.g. water temperatures, development in biological growth, biological challenges such as diseases, algae blooms etc. and market developments.
MHG – 2014 volume guidance Actual harvest volumes will be affected by e.g. water temperatures, development in biological growth, biological challenges such as diseases, algae blooms etc. and market developments.
Outlook • Strong demand expected to continue • Forward prices of NOK 38.8 per kg for Q2-Q4 2014 • However, higher supply growth expected for remainder of year • Strategic focus areas • Successful development of green-field feed capacity • Acquisitions in Norway and Chile • Integration of Morpol • High sea lice awareness in Norway – Chile remains concerning • Risk of adverse regulatory change in Norway • Quarterly dividend of NOK 5 per share proposed to AGM