Download
1 / 7
70 likes | 223 Views
Examples of FMI’s work Ari Venäläinen, Kirsti Jylhä Ilmatieteen laitos. Change in the number of snow cover days (%) from 1961-1990 to 2071-2100. Ari Venäläinen and Kirsti Jylhä Ari.Venalainen@fmi.fi. Observed number of snow cover days. Ari Venäläinen and Kirsti Jylhä Ari.Venalainen@fmi.fi.

E N D
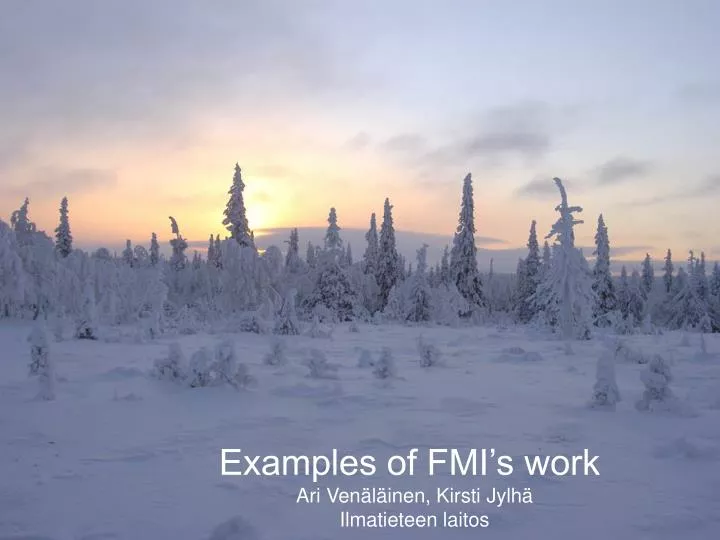
Examples of FMI’s work Ari Venäläinen, Kirsti Jylhä Ilmatieteen laitos RT6 Plenary Prague GA
Change in the number of snow cover days (%) from 1961-1990 to 2071-2100 Ari Venäläinen and Kirsti Jylhä Ari.Venalainen@fmi.fi RT6 Plenary Prague GA
Observed number of snow cover days Ari Venäläinen and Kirsti Jylhä Ari.Venalainen@fmi.fi RT6 Plenary Prague GA
Precipitation extremes in Finland • 12 observing stations • Variable length of time series • Monthly data about 100 years, daily about 50 years • Parameters examined: • monthly, two week, five day, daily and six hour precipitation • the length of dry spells (thresholds 10, 50, 100 and 200 mm) Ari Venäläinen and Kirsti Jylhä Ari.Venalainen@fmi.fi RT6 Plenary Prague GA
The variation of return level estimates for dry spell lengths among the studied 12 stations Ari Venäläinen and Kirsti Jylhä Ari.Venalainen@fmi.fi RT6 Plenary Prague GA
The variation of return level estimates for monthly, two weeks and daily precipitation among the studied 12 stations. Ari Venäläinen and Kirsti Jylhä Ari.Venalainen@fmi.fi RT6 Plenary Prague GA
CONCLUSIONS • Large differences in the return levels between the 12 stations used in the study, i.e. the level that represents a 10 year return period at one station may be a 500 year level at another location. • These differences may be caused not only by the spatial variation of climate but also by the relatively short measuring periods and the limitations statistical extreme value analyses have. • The physics behind the most rare events may be something that we are not able to take into account. • The changing climate causes further challenges when calculating the return periods. What is past, present and future climate? • Future work; similar kind calculations using climate scenarios. Ari Venäläinen and Kirsti Jylhä Ari.Venalainen@fmi.fi RT6 Plenary Prague GA