Download
1 / 47
470 likes | 602 Views
Secondary succession: changes in relative abundance of tree species at Hubbard Brook Experimental Forest. 34 invertebrate communities in streams A, B, C, D indicate community types determined by classification. Classification.

E N D
Secondary succession: changes in relative abundance of tree species at Hubbard Brook Experimental Forest
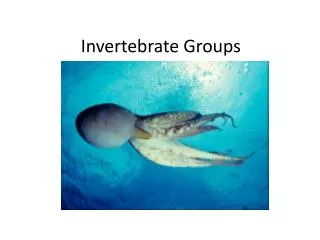
34 invertebrate communities in streams A, B, C, D indicate community types determined by classification
Primary succession: colonization of concrete blocks in intertidal zone by algae
Keystone species Sea otter urchins kelp
Heterotrophic succession: fungal populations colonizing pine litter
No disturbance Periodic density-dependent disturbance
Littorina littorea Enteromorpha Chondrus Preferred food Poor food source Dominant competitor Poor competitor
Ecosystem: Tansley (1935) “The more fundamental conception is… the whole ecosystem including not only the organism-complex, but also the whole complex of physical factors forming what we call the environment… We cannot separate the organisms from their special environment with which they form one physical system…. It is the system so formed which provides the basic units of nature on the face of the earth.”
Gross photosynthesis Topt Rate of photosyn or respiration Net photosynthesis Net photosynthesis respiration temperature temperature
Water deficit: Potential evapotranspiration (PET) - precipitation (PPT)
NPP along transect from coast of Georgia to edge of continental shelf
Consumption efficiency Energy ingested at trophic level n Energy produced at trophic level n-1
Assimilation efficiency Energy assimilated at trophic level n Energy ingested at trophic level n
Production efficiency Energy produced at trophic level n Energy assimilated at trophic level n
forest grassland lake stream
O2 H2O + CO2 respiration Decomposer Amino acids, Carbohydrates, Lipids, Nucleic acids Proteins, etc. immobilization Inorganic Nutrients NO3-, SO4--, PO4--- Mg, Mn, Fe, Ca, K, etc Dead animal or plant matter Organic C, E, nutrients mineralization
% remaining Time Limiting nutrients Immobilized Decay rate increased by increased content of limiting nutrients All nutrients mineralized Decay rate decreased by increased content of limiting nutrients
Stages of decomposition • Early: • Autolysis • Leaching of dissolved OC, minerals • Colonization by bacteria and fungi • Decomposition of sugars and amino acids > starch > cellulose • Population explosion of early colonizers
Stages of decomposition • Intermediate/Late • Microorganisms specializing in using resistant material colonize > high diversity • 1 g soil: 10,000 genetically distinct bacteria • Degrade cellulose, complex proteins, lignins • Physical contact required (e.g., membrane surface enzymes)
% Original remaining Time (weeks) Time (weeks) Time (weeks) Nutrient dynamics during decomposition in a Scots pine forest, Sweden
% Original remaining Time (weeks) Time (weeks) Time (weeks) Nutrient dynamics during decomposition in a Scots pine forest, Sweden
Concentrations of solutes in streams draining Hubbard Brook experimental catchments W2 (deforested and treated with herbicides in 1965) and W6 (control)