Download
1 / 40
400 likes | 805 Views
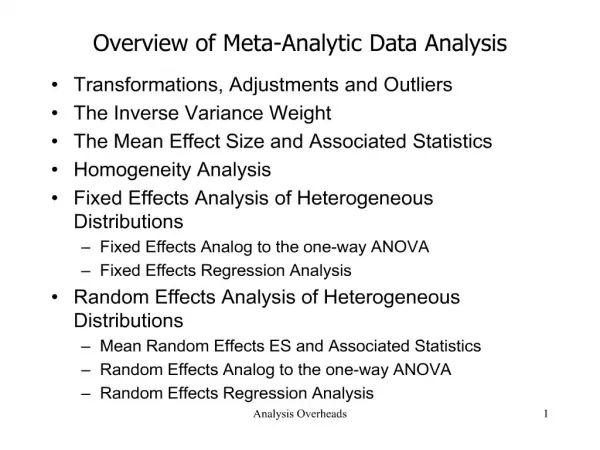
Emerging analytic methods for transportation data analysis: Examples with highway-safety data. Fred Mannering Charles Pankow Professor of Civil Engineering Purdue University. Emerging Analytic Methods.

E N D
Emerging analytic methods for transportation data analysis: Examples with highway-safety data Fred Mannering Charles Pankow Professor of Civil Engineering Purdue University
Emerging Analytic Methods • Statistical and econometric advances in the last decade plus have opened up exciting new possibilities for the analysis of data • These new methods address issues of endogeniety, self-selectivity, unobserved heterogeneity and others that allow new insights to be gained from traditional and emerging data sources
The Case of Highway Safety • More than 1.2 million people die annually in highway-related crashes and as many as 50 million more are injured (World Health Organization, 2013) • Highway-related crashes are projected to be the 5th leading cause of death in the world by 2030
Traditional Crash Data • Available mostly from police and possibly other reports • Provide basic data on the characteristics of the crash • Road conditions • Estimates of injury severity • Occupant characteristics (age, gender) • Vehicle characteristics • Crash description, primary cause, etc.
Emerging Data Sources • Data from driving simulators • Data from naturalistic driving • Data from automated vehicles
Why Analyze Traditional Crash Data? • Identify crash-prone locations • Hoping that data analysis will suggest effective countermeasures • Evaluate the effectiveness of an implemented countermeasure
Traditional Analysis Approaches: • Models of crash frequency over some specified time and space • Models of crash-injury severity (which is conditional the crash having occurred) • Some modeling approaches have combined the two (frequency and severity)
Crash Frequency Models: • Study crash frequency over some specified time and space • Various count-data and other methods have been used • Explanatory variables: • Traffic conditions • Roadway conditions • Weather conditions Traditional crash data
Crash Injury Severity Models: • Study injury severities of specific crashes • Various discrete-outcome and other methods have been used • Explanatory variables: • Traffic Conditions, Roadway conditions, Weather conditions • Specific crash data: Vehicle information, Occupant information, Crash specific characteristics Traditional crash data
What Methodological Barriers have Encountered? • Unobserved Heterogeneity • Endogeneity • Self-selectivity • Temporal Correlation • Spatial Correlation
Unobserved Heterogeneity: • Many factors influencing the frequency and severity of crashes are simply not observed • If these are correlated with observed factors, incorrect inferences could be drawn Traditional crash data
Example: A study finds age to be an important factor in crash frequency/severity • Problem: • Age is correlated with many underlying factors such as physical/mental health, attitudes, income, life-cycle factors, etc. • Naive methodological application: • Effects of age are a proxy for unobserved factors – the correlation may not be stable over time and inferences relating to age may be incorrect • Another example: Men and women running in a dark room Unobserved heterogeneity
Example:Impact of ice warning signs on frequency/severity of ice-related crashes • Analyze the frequency/severity of crashes when ice warning signs are present vs. not present • Problem: • Ice warning signs are put at locations with a high frequency and severity of ice crashes • Naive methodological application: • Effectiveness of ice-warning signs understated (may find they actually increase frequency and severity) Endogeneity
Risk Compensation • Advanced Safety features: • Encourage drivers to drive more aggressively to shorten travel times • Encourage distracted driving as the same level of safety can be reached with less attention Risk Compensation
Marginal Rate of Transformation between safety and driving intensity Risk Compensation
Summarizing… • If intensity is a normal good, consumption should be to the right of B • Range could be from B (consume all safety) or to C (consume all intensity) • Or even over consume intensity (for example, point E) Risk Compensation
Good Morning America http://abcnews.go.com/Video/playerIndex?id=2530346
Example: Effectiveness of Side-Impact Airbags (applies to other advanced safety features) • Analyze the severity of crashes involving vehicles with and without side-impact airbags • Problem: • People owning side-impact airbags are not a random sample of the population (likely safer drivers) • Naive methodological application: • Side-impact airbag effectiveness is overstated Endogeneity: Self Selectivity
Example: Side Airbag Effectiveness? • Insurance Institute for Highway Safety reports: • 2004: 45% effective in reducing fatalities • 2006: 37% effective in reducing fatalities • 2008: 30% effective in reducing fatalities • 2012: 24% effective in reducing fatalities
Ignoring self-selectivity will almost always overstate the effectiveness of new safety features due to self-selectivity • May mask important factors relating to possible risk compensation, etc. • Statistical corrections must be used • Another Example: Smoking during pregnancy Endogeneity: Self Selectivity
Example: Effectiveness of Motorcycle Safety Courses • Analyze the frequency and severity of crashes involving riders with and without course experience • Problem: • People taking the course are not a random sample of the population (likely less skilled) • Naive methodological application: • Effectiveness of the course understated (course participants may have higher crash rates) Endogeneity: Self Selectivity
Underlying issue: • There is unobserved heterogeneity about drivers that can manifest itself as a self-selectivity problem • This can mask causality and lead to erroneous inferences and policies Endogeneity: Self Selectivity
Temporal and Spatial Correlation • Crashes in close spatial proximity will share correlation due to unobserved factors associated with space (unobserved visual distractions, sight obstructions, etc.) • Crashes in occurring near the same or similar times will share correlation due to unobserved factors associated with time (precise weather conditions, similar sun angle, etc.) • Spatial econometrics Traditional crash data
Omitted Variables • Many crash frequency models use few explanatory variables (some only use traffic) • This creates a massive bias in parameter estimates that most certainly will lead to incorrect and temporally unstable inferences Traditional crash data
Building on Old Research • Highway Safety Manual (HSM) in the U.S. is an important practice-oriented document • However, it is several methodological generations behind the cutting-edge econometrics in the field • Problem: Some researchers view the HSM as the cutting edge and they base their work on terribly outdated methods and thinking Traditional crash data
Traditional Data Methodological Opportunities
New Data • Naturalistic Driving Data – extensively instrumented conventionally operated vehicles • Simulator Data – massive amounts of data collected from driving simulators • Automated Vehicle Data – including automated vehicle performance and response of drivers of conventional vehicles
New Data • Unobserved heterogeneity • Endogeneity • Self-selectivity (route choices, etc.) • Temporal correlations • Spatial correlations • Vehicle-to-vehicle correlations • Realism (for naturalistic driving and simulator data, how does the experiment affect behavior) Naturalistic Driving, Simulator, Automated Vehicle Data
Automated Vehicle Data: • Complex and heterogeneous responses of conventional vehicle drivers to automated-vehicles • Understanding driver responses will be critical to proper design of automated vehicle systems Naturalistic Driving, Simulator, Automated Vehicle Data
Current Methodological Frontier • Random parameter/finite-mixture models • Multi-state models (Markov switching) • Simultaneous equation models including multivariate models • Heckman-type selectivity correction techniques • Others
Some Recent Papers • An exploration of the offset hypothesis using disaggregate data: The case of airbags and antilock brakes. Journal of Risk and Uncertainty • Basis for GMA 2006 video • Addresses self-selectivity (safe drivers buy safe vehicles) • Addresses changing behavior over time due to risk compensation
Some Recent Papers (cont.) • The heterogeneous effects of guardian supervision on adolescent driver-injury severities: A finite-mixture random-parameters approach. Transportation Research Part B (2013) • Effectiveness of guardian supervision is highly variable and influenced by many unknown factors • Studied by considering latent-class heterogeneity and heterogeneity within classes
Some Recent Papers (cont.) • The analysis of vehicle crash injury-severity data: A Markov switching approach with road-segment heterogeneity. Transportation Research Part B (2014) • Accounting for cross-sectional and time-varying heterogeneity can be difficult • Markov switching between two or more safety states can be used to address time-varying heterogeneity while traditional random parameters can address cross-sectional heterogeneity
Some Recent Papers (cont.) • Implementing technology to improve public highway performance: A leapfrog technology from the private sector is going to be necessary. Economics of Transportation (2014) • Outlines the economic benefits and implementation barriers to new transportation technologies including automated vehicles
Summary • In the past, comparatively “static” data quality and quantity has enabled sophisticated methodological applications to extract much of the available information • A new data-rich era is beginning • With few exceptions, sophisticated methodologies have not been widely used in analyzing these data
Methodological applications are needed that address underlying data issues (unobserved heterogeneity, etc.) • The methodological frontier needs to expand to include sophisticated new statistical and econometric methods Summary (cont.)