Download
1 / 20
200 likes | 360 Views
Detecting the Domain Structure of Proteins from Sequence Information. Niranjan Nagarajan and Golan Yona Department of Computer Science Cornell University. What’s and Why’s. Why? Function Prediction Improved Alignments and more accurate Evolutionary Studies Protein Design What?

E N D
Detecting the Domain Structure of Proteins from Sequence Information Niranjan Nagarajan and Golan Yona Department of Computer Science Cornell University
What’s and Why’s • Why? • Function Prediction • Improved Alignments and more accurate Evolutionary Studies • Protein Design • What? • Delineating Sequence Contiguous Domains • Work exclusively on Sequence Information
Past Work • The Pfam Protein Families Database, Bateman et al (2002) Nucleic Acids Research 30:276-280 • ProDom and ProDom-CG: tools for protein domain analysis and whole genome comparisons, Corpet et al (2000) Nucleic Acids Research 28:267-269 • Automated Protein database classification: I. Integration of compositional similarity search, local similarity search and multiple sequence alignment. II. Delineation of domain boundaries from sequence similarities, Jerome et al (1998) Bioinformatics 14:164-187
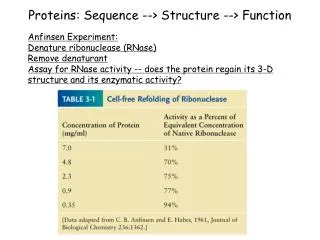
Overview of the Process Seed Sequence Sequence Participation blast search Multiple Alignment Secondary Structure Entropy Neural Network Correlation Contact Profile Physio-Chemical Properites Final Predictions
Motivation • Simple and Extensible • Tests an array of novel sources of information • Automated method based on statistical analysis of the scores • Domain transition signals are learned rather than programmed in
Score Design • Efficiently Computable • Yields single value per profile column • Robustness to Alignment inaccuracies • Useful in distinguishing in-domain from out-domain columns in isolation or in combination with other scores
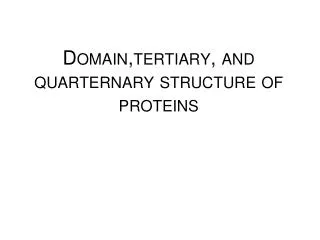
Correlation • Measures the conservation of the alignment in a region High Correlation Low Correlation
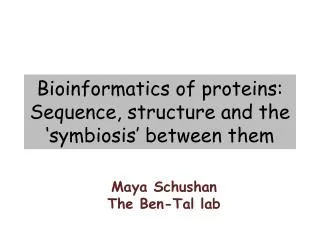
Entropy • Estimates the diversity of the amino-acid distribution for a column Low Entropy High Entropy
Sequence Participation • Identifies and quantifies the significance of regions where there is a major change in sequence participation
Secondary Structure • Uses psipred secondary structure predictions for the seed sequence
Contact Profile • Contacts are predicted based on correlated mutation values that are significantly larger than random values
Physio-Chemical Properties • We tested properties like Hydrophobicity, Molecular Weight, and Charge and various classifications of the amino acids for their information content • Scores were calculated by: • Using the classification to assign values in the range [0, 1] to every residue • Taking the average of the values for a profile column
Generating the Data Set • Seed Sequences: 4810 non-redundant (95% identity) PDB sequences that are at least 40 amino acids long (PDB data as of may 2002) • Alignments: • The seeds were blasted against a composite non-redundant database with 693,912 non-fragmented entries • The resulting hits were compiled in a database • The seeds were queried using PSI-BLAST (until convergence) against these smaller databases to generate the alignment • Domain Definitions: Definitions in SCOP 1.57 were used (seeds with inconsistent definitions or less than 90% coverage were removed) • The final set, after filtering to ensure to ensure a balance in the number of single (576) and multi-domain (605) proteins, contained 1181 seed proteins and their alignments
Massaging and Optimizing the Scores • Scores were smoothed over various smoothing windows to test the importance of evening out local fluctuations • Scores were normalized to ensure that values from different proteins were comparable • The size of the smoothing window was optimized using the Jensen-Shannon Divergence between the distributions for in-domain and out-domain columns
Designing and Training the Neural Network • Matlab’s Neural Network Toolbox was used to design and train networks • Network Properties: • Feed-Forward Back Propagation network with Tangent Sigmoid activation function • Current best network takes in 11 inputs and has two hidden layers with 10 and 5 neurons respectively • Neural network trained on a set of 484 proteins with a validation set of 237 proteins and test set of 460 proteins • Best network has accuracy of 91% for in-domain and 70% for out-domain columns in test set
From Neural Network to Cutpoint Predictions • A column is predicted as a cutpoint if a significant fraction of columns in a window centered at it are predicted as being out-domain • For regions with multiple cutpoints near one another, minimas of the smoothed prediction curve are used to decide the most suitable cutpoint
Comparative Results • Accuracy evaluates predictions with respect to the true definitions • Sensitivity evaluates true definitions with respect to the definitions
Examples • Seed Number: 9847 • PDB ID: 1b6s chain D • Domain Definition:1-78, 79-276, 277-355 • Predicted Cutpoints: 73, 271 • PFam Definition: 30-167
More Examples • Seed Number: 11791 • PDB ID: 1acc • Domain Definition: 14-735 • Predicted Cutpoints: 158, 583 • PFam Definition: 103-544
Highlights • Correctly predicts domain definitions for 237 (52%) of the proteins in the test set thus comparing favorably with PFam (258 and 56%) • The procedure is simple and fast and comparable in accuracy and coverage to PFam • General purpose method for delineating domain boundaries that relies solely on sequence information