Download
1 / 12
130 likes | 161 Views
Big data helps bust the top three myths of employee engagement and leadership. This report has used big data to shed new light on some commonly held beliefs.

E N D
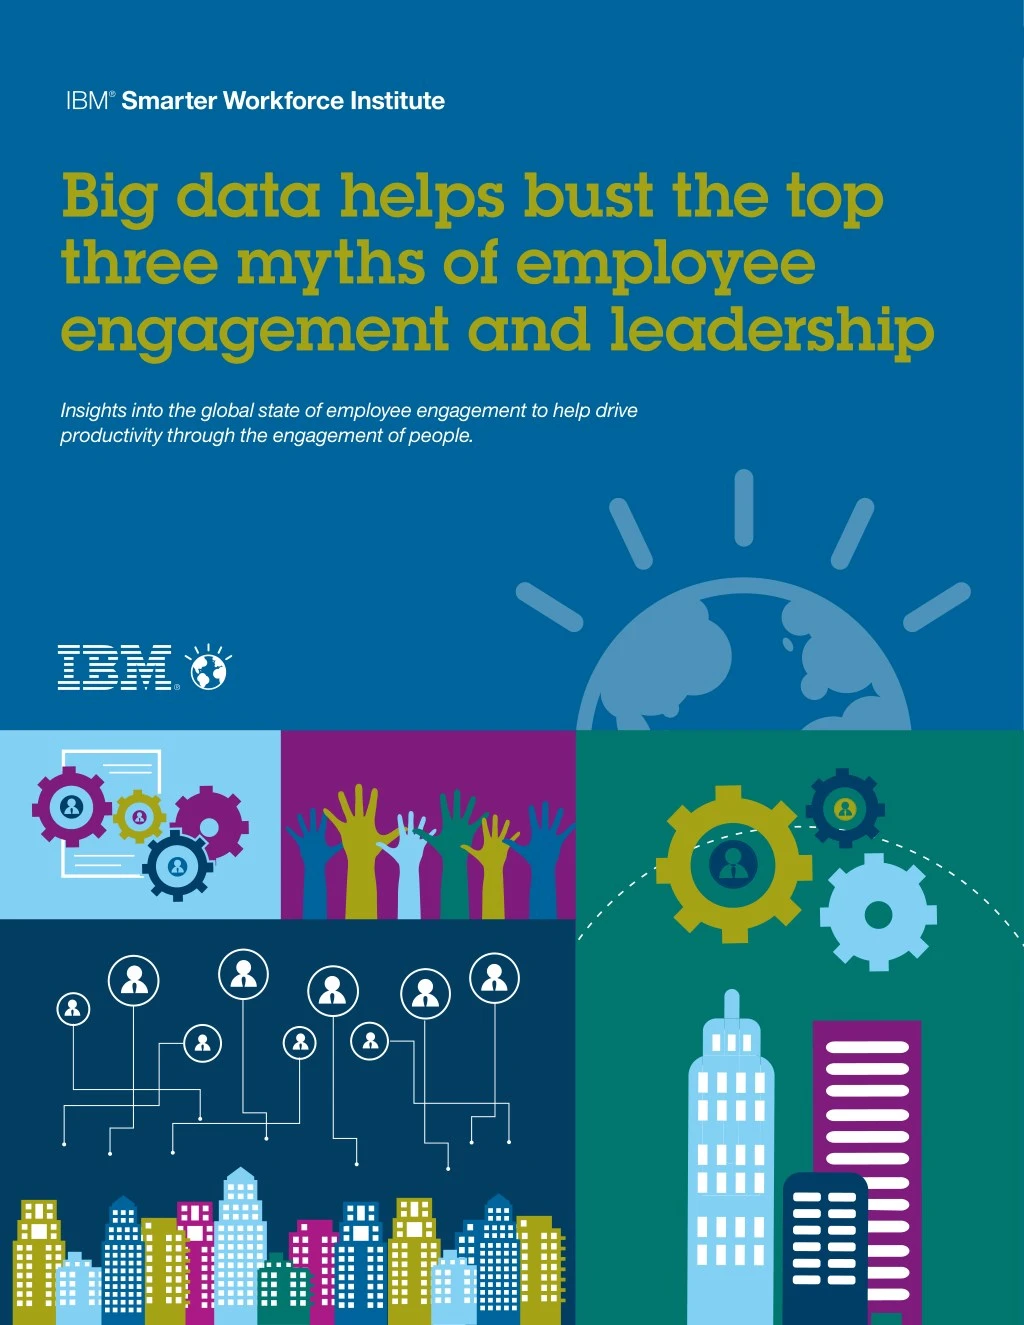
1 Big Data Helps Bust the Top Three Myths of Employee Engagement and Leadership Big data helps bust the top three myths of employee engagement and leadership Insights into the global state of employee engagement to help drive productivity through the engagement of people.
2 An IBM® Smarter Workforce Institute Report Authored by Jeffrey Jolton, Ph.D. and Bryan Hayes , Ph.D. Contributions made by Rena Rasch, Ph.D. and Bob Weldon, Ph.D. The IBM® Smarter Workforce Institute features a multidisciplinary team of expert psychologists and researchers. With offices in London and Minneapolis, the Smarter Workforce Institute oversees rigorous, global, and innovative research and development programs spanning all aspects of human capital management.
3 Big Data Helps Bust the Top Three Myths of Employee Engagement and Leadership Executive Summary Doing more with less has become familiar to many of us—and our workforce is no exception. The World Bank estimates global GDP grew 2.3% in 2012, with expected continued moderate growth in 2013 (The World Bank, 2013). Much of this growth is driven by the human side of the equation. Between 2011 and 2012, 90% of countries saw an increase in productivity i.e., GDP per capita (IMF World Economic Database, 2013). Since 1993, revenue per employee has seen a 3.2% compound annual growth rate compared with little to no growth in revenue per cost of goods sold or per invested capital (CEB, 2013). These facts illustrate what most leaders know: companies (and countries) should be able to do more with the employees they have. Employee engagement is increasingly seen as a fundamental mechanism through which to attain superior organizational performance (IBM, 2013). Fundamentally, organizations can do more with more engaged employees. Presented in this report are insights into the global state of employee engagement based on one of the biggest employee research databases ever assembled. These insights help provide a roadmap for driving productivity through engagement of people. Armed with these big data, we identified three key findings that can challenge some of the commonly held beliefs concerning employee engagement and leadership: • Neither the sky nor employee engagement is falling. Contrary to popular reports, in almost each country, our big data indicate employee engagement was up in 2012 compared to both 2010 and 2011. • People join companies, but leave managers companies. The adage that people leave managers is not supported by big data. Although managers play an important role in supporting the engagement and retention of employees, they cannot go it alone. Their senior leaders should step up and take responsibility for delivering on what has been consistently the most important driver of employee engagement over the last five years—communicating a motivating vision of their organization’s future and inspiring confidence in their employees. • The economic crisis should not be used a scapegoat. Compared to 2008, senior leaders’ ability to inspire confidence and motivate employees towards a shared vision was rated more positively in 2009, at the peak of economic turmoil. Ratings generally remained consistent or actually improved in 2010 and 2011. It was only in 2012, three years after the crisis, that confidence in leadership took a notable hit. Further, senior leaders were rated similarly or more positively in mature, stable and even economically challenged markets. These data suggest the economic crisis should not be used to explain poor perceptions of senior leader performance. In addition to sharing the evidence for these myth-busting insights, this report will also give leaders valuable guidance into their role in promoting employee engagement to build organizational success. For companies to be successful, employees must be engaged to perform, innovate and drive outcomes. This report will help organizations proactively manage employee engagement for future productivity by drawing attention away from what matters less—the economic climate and direct managers—and focusing on what matters more—visionary leadership.
4 An IBM® Smarter Workforce Institute Report Neither the Sky Nor Employee Engagement is Falling The big data presented here reveal the global state of employee engagement is fairly strong and getting stronger. However, reading news clippings and reports from many consulting firms would lead to a very different conclusion (Zenger, 2013). In recent years, others have published conclusions including: The Positive Power of Listening to Employees Results of this big data analysis are shown in Figure 1. Contrary to the proclamations of others, 70% of employees at organizations surveyed by IBM around the world (average of 4.5 million employees surveyed each year from 2008 to 2012) are engaged and only 12% of employees are disengaged (not shown). The results presented in Figure 1 also highlight the effectiveness and protective power of listening to employees and monitoring the workforce. Organizations that surveyed their employees saw engagement levels on average 20 percentage points higher than those that did not survey employees. Evidently, making engagement a priority by listening to employees, for example by conducting a survey, does help make a difference. How the survey is conducted also appears to matter. Organizations using IBM’s survey methodology saw average employee engagement levels a further three percentage points higher than companies that surveyed employees, but not necessarily with IBM. • • Only 30% of the US workforce is engaged (Gallup, 2013). Only 11% of the global workforce is engaged and 27% are actively disengaged (Gallup, 2010). Globally, 40% of employees are passively or actively disengaged (AONHewitt, 2013). 22% to 42% of the workforce is engaged, depending on the global region, with 11% to 24% disengaged (BlessingWhite, 2013). • • Perhaps these reports simply have not considered a big enough data source for their conclusions, because our analysis shows an altogether brighter outlook, especially for companies that make engagement a strategic priority by surveying their employees. Employee engagement1 is up globally, with many countries experiencing more motivated and committed workers. FIGURE 1: Global Employee Engagement Levels by Year Survey with IBM Survey with a provider other than IBM Do not survey The data used for this report come from two sources: the WorkTrends™ survey and the WorldNorms database: 75 • WorkTrends is an annual global survey, which in 2012, surveyed over 33,000 employees across multiple countries, industries, and organizations. WorldNorms is IBM’s database containing survey data from: – Hundreds of organizations. – Over 14 million employee opinions collected from 2010 to 2012. – Companies ranging in size from 100 to over 300,000 employees (20,000 average). – Twenty industries and 215 countries. – Over 725 million survey responses. 70 Percent Favorable 65 60 • 55 50 45 40 2008 2009 2010 2011 2012 WorkTrends gives us a peek into the average employee’s experience, while WorldNorms provides a full view into the experience of employees whose leaders make engagement a strategic priority. Our conclusions about the state of employee engagement are reinforced by the convergence of these two independent sources of information. The Protective Power of Surveying Employees The trend lines in Figure 1 reveal another important finding—IBM clients have endured far fewer fluctuations in their employee engagement levels over the last five years. Other organizations saw between five and nine percentage point swings in engagement over the same time period, yet the biggest change for IBM clients was just three percentage points between 2008 and 2009. “Organizations that surveyed their employees saw engagement levels on average 20 percentage points higher than those that did not survey employees.” The data suggest that taking action on what matters most to employee engagement can not only build engagement, it can also help to counter the potentially negative impact caused by outside influences. Later in this report, we explore the top drivers of employee engagement that have enabled these companies to buck the trend and help create a more consistent and productive experience for employees. 1IBM defines employee engagement as the extent to which employees are motivated to contribute to organizational success, and are willing to apply discretionary effort to accomplishing tasks important to the achievement of organizational goals. IBM’s employee engagement index assesses employee pride, satisfaction, commitment and advocacy.
5 Big Data Helps Bust the Top Three Myths of Employee Engagement and Leadership Global Employee Engagement Up in Nine out of Ten Countries Engagement levels globally were either relatively stable or on the rise in 2012. Employees around the world reported being more engaged in 2012 compared to 2010. In particular, IBM clients saw a welcome return to the peak engagement levels not seen since 2009. This positive outlook can also be seen in a detailed look at individual countries—employee engagement is up in most countries around the world. Furthermore, stories of employees bottoming out just do not seem credible. We believe most employees want to be engaged, they want to be excited about their company, their jobs and coming to work each day. As a result, the evidence shows that employees voluntarily give their feedback on surveys used to drive engagement—IBM clients averaged an employee participation rate of over 80 percent in 2012. It does not seem logical that so many chronically disengaged employees would be so forthcoming and eager to share their thoughts. A big data analysis of survey responses from more than nine million employees2 shows employee engagement levels by country from 2010 to 2012 in select countries (Figure 2). The second column in Figure 2 for each country represents the percentage point change in employee engagement in 2012 compared to 2010. Of the twenty countries presented, only three show a decrease in engagement from 2010 to 2012, and two of those three countries in decline demonstrated the minimal change of a single percentage point. Almost each place where we look across the globe, employee engagement scores are up—a happy pandemic of sorts. People Join Companies, But Leave Managers Companies The second myth that our big data helps bust is the old adage that people join companies, but leave managers. Any leader who thinks employees’ immediate managers are primarily responsible for their engagement and retention is sorely mistaken. While direct managers and supervisors can certainly impact engagement, both directly and indirectly, and no doubt some employees do indeed leave companies because of their manager, our data suggest managers have far less direct impact on engaging employees and driving retention than other factors. In fact, several of the top drivers of employee engagement are directly related to the actions of senior leaders. Cumulatively, these results challenge the claims of record low engagement levels. After all, these results represent the views of nine million employees around the world. Figure 3 provides evidence for what is found anecdotally across many organizations. People primarily leave companies when they believe they and/or their company does not have a good future. Other factors are often secondary, such as pay, work-life-balance and treatment by the immediate manager. One word of caution when interpreting this table—it should not be taken as applying to each employee in each organization. It is advisable to undertake specific analyses to isolate the root causes of turnover in specific job families within specific companies. The data do, however, illustrate the general trend that is seen across organizations. FIGURE 2: Employee Engagement Changes from 2010 to 2012 in Select Countries Employee Engagement Score in 2012 Country Change from 2010 Argentina 66 +2 Australia 67 +2 Belgium 64 -1 Brazil 71 +4 FIGURE 3: Determinants of Turnover Intentions Canada 69 +4 China 66 +4 Columbia 82 -5 Relative Influence On Turnover Intentions* Determining Factor France 61 +8 Germany 64 +2 34% I can achieve my career goals at this company. India 75 +4 30% I believe my organization has an outstanding future. Japan 53 +3 14% I am paid fairly for the work I do. Mexico 79 0 My life is well-balanced between work, family, friends, and my personal needs. 12% Russia 71 +2 11% My manager treats me with respect and dignity. Saudi Arabia 74 -1 100% Total variance explained was 49% South Africa 67 +1 Spain 70 +8 *Relative influence on turnover intentions derived from analysis of 2012 WorkTrends™ data. Turnover intentions was measured by the combined average of responses to “I rarely think about looking for a new job with another company” and “I am seriously considering leaving my organization within the next 12 months”. Values represent relative weight of each factor in explaining turnover intentions. Factors were identified using Stepwise Regression analysis with relative influence determined by Relative Weights Analysis. Sweden 63 +4 Turkey 68 +3 United Kingdom 63 +4 United States 71 +2 24.28 million employees surveyed in 2010 and 4.9 million employees surveyed in 2012.
6 An IBM® Smarter Workforce Institute Report FIGURE 4: Ranked Drivers of Employee Engagement “Leaders’ ability to focus energy on an inspiring mission is key to driving organizational success...” 2008 2009 2010 2011 2012 Leadership future vision 1 1 1 1 1 Recognition 4 3 2 3 2 Quality and customer focus 4 6 5 5 2 Future Vision from Senior Leaders Drives Engagement Moving beyond the retention of employees, engaging employees is critical for productivity and organizational performance. Here again, managers, while important, are not the most important driver. Looking across client surveys, each year we are able to identify the topics that have the strongest relationship to employee engagement. We consider these topics to be “drivers” of engagement—meaning that improvements in engagement are likely related to improvements in these topics. Our extensive client work has demonstrated that if organizations take action on their drivers of employee engagement, then they can see a corresponding improvement in employee engagement. Further, we have observed that corresponding improvements in engagement are not as significant when action is taken on topics that are less strongly related to engagement. Drivers of engagement are one of the best ways to understand what can support and increase employee engagement in work environments. Diversity and inclusion 2 5 5 3 4 Growth and development 3 3 2 5 4 Collaboration involvement 4 2 2 2 4 Ethics and corporate governance 4 6 8 10 7 Performance management 9 10 7 7 7 Creating change 4 6 8 7 9 Open communication 9 6 8 10 9 Leadership living values 11 10 8 7 11 Manager effectiveness 11 10 8 10 11 It is also important to recognize that while manager effectiveness may not rank highly as a driver of employee engagement (Figure 4), managers do matter. A growing body of evidence confirms that a bad or “toxic manager” (Reed, 2004) can have a profound, negative impact on the employee experience, in effect causing disengagement. Fundamentally, the ranked drivers analysis reveals that some of the best possible managers in the world cannot usually retain or engage employees on their own. Senior leaders play a fairly significant role in driving high levels of commitment and motivation. To define the top drivers of engagement, we look at commonly used items and their statistical relationship to the employee engagement index. Those with the strongest relationship (correlation) were given higher rankings. Items were aligned to themes and their relative rankings are show in Figure 4. The data suggest that a shift in focus is required—away from direct managers being the primary, if not sole, implementers of employee engagement related action plans to senior executives leading by example, creating a vision of an outstanding future for both the company and the employee. Leaders’ ability to focus energy on an inspiring mission is key to driving organizational success via the alignment of employees to this vision. As demonstrated in Figure 4, the top drivers of employee engagement have been fairly consistent over the last five years, with leadership future vision consistently topping the list. Senior leaders are critical to the creation and communication of their organization’s future vision. Very simply, this is a driver of employee engagement that should not be delegated. In contrast, the five-year trend analysis in Figure 4 highlights that manager effectiveness is not typically a prominent or top ranked driver of employee engagement. In contrast to popular beliefs and statements about managers having a great deal of influence over their employees’ engagement, the data reveal that a sole focus on managers to drive engagement is unlikely to deliver significant improvements. Rather, executives or senior leaders can have a much greater impact on employee engagement by communicating a strong and inspiring future vision. How Well Are Leaders Creating a Vision? Taking our analysis a step further, we wanted to examine how effective leaders are at creating and communicating this future vision. In other words, are they driving engagement as much as they possibly can, or is there room for improvement? We analyzed employees’ agreement with three items that are most clearly associated with the future vision driver: • • I believe the company has an outstanding future. Senior leadership communicates a vision of the future that motivates employees. I am confident that senior leadership is making the right decisions for the company. It is important to note that while the ranking in Figure 4 generally holds true across organizations and industries, there are a few notable exceptions. For example, in the retail industry, the manager does have a more significant impact on the employee experience and subsequent employee engagement. •
7 Big Data Helps Bust the Top Three Myths of Employee Engagement and Leadership The analysis revealed that in 2012 across geographic regions and industries, there is room for improvement. Across the three items, between one-quarter and one-third of employees remain neutral or negative about the future prospects of their company, their senior leaders’ ability to communicate a motivating vision and their confidence that senior leaders are making the best possible decisions (Figure 5). would get them through the difficult times and could, therefore, emerge stronger on the other side. This is mirrored by the small increase in the communication of a future vision that motivates people between 2008 and 2009. FIGURE 6: Trends in Leadership Ability to Drive Future Vision Over Five Years More striking is the gap between the global average and top performers, as shown in Figure 5. Top performers represent the average percent favorable score among those companies that meet or exceed the top 10th percentile cut score for the item. In short, the top performers line highlights the opportunity for improvement in the performance of senior leaders, with a potential for 17 to 18 percentage point increases across the three items. Such improvements, as we have already demonstrated above are usually linked to improvements in employee engagement, which in turn are typically linked to improvements in organizational performance. Company has an outstanding future Senior leadership communicates a motivating vision Confidence in leadership decision making 90 80 Percent Favorable 70 60 FIGURE 5: How Well Are Leaders Creating a Vision? 50 40 Global average 2012 Top performers 2012 2008 2009 2010 2011 2012 100 90 92% 84% 80 78% 74% However, the stable or slightly upward movements in employees’ views of their senior leaders changed in 2012 when all three elements of future vision decreased (see Figure 6). Most notably, confidence in senior leaders’ ability to make the right decisions dropped from 69 to 64 percent between 2011 and 2012. In fact, 2012 is the first year over the last five in which all three items declined from the previous year. 70 Percent Favorable 67% 60 60% 50 40 30 20 This recent fall in employees’ views of senior leaders could be a matter of serious concern. In this report, we have already demonstrated just how strongly employee engagement is linked to leaders’ ability to communicate a future vision. If employee perceptions of leaders are falling, then this could be a harbinger of a future drop in employee engagement. 10 0 Company has outstanding future Senior leadership communicates a motivating vision Confidence in leadership decision making Trends in Future Vision—Trouble on the Horizon? While this snapshot of how well leaders are doing is interesting, looking back over the last five years allows us to identify potential trends and make some informed predictions about the next five years. THE IMPORTANCE OF LONG-TERM VISION One global organization recently discovered that positive perceptions of its future vision had dropped among its senior managers and directors. Not only that, but employee engagement had also dropped a very significant eight percentage points. Further analysis revealed that the messaging from senior leaders around the future vision had become very short-term, with a strong focus on making numbers quarter-to-quarter. That message was more about business performance than an inspiring goal and it lacked the personal connection that can make a strong future vision so impactful. The historical view of the performance of leaders (Figure 6) reveals strongly consistent employee perceptions of senior leaders, despite the economic turmoil of the time. In 2009, there was a boost in the perceptions around the organization having an outstanding future. Perhaps the global financial crisis of the time drove leaders to be much more visible and to articulate where the business was going. Furthermore, the fact that the organization was surviving through this difficult period appears to have convinced employees that their leaders
8 An IBM® Smarter Workforce Institute Report The Economic Crisis Cannot be Used a Scapegoat In this report, we have already established that setting a motivating vision for the company’s future has typically been a top driver of employee engagement over the past five years. However, it could be argued that leadership effectiveness is simply a product of the wider economic environment. If this were the case, then there could be very little leaders can do to affect their employees’ engagement—after all, the wider economic environment is not exactly under their control. To test this hypothesis, we analyzed differences in perceptions of leaders by countries of varying economic conditions. For simplicity, and to ensure fair comparison between countries, the data is taken from one time period (2012). FIGURE 8: Future Vision in Mature Markets (standardized scores) U.S. UK Australia The Netherlands Germany Japan 60 58 56 54 52 50 48 46 44 42 40 Percent Favorable Avg Room for Improvement in Mature Markets Looking at individual countries, we can see that room for improvement exists, especially senior leaders’ ability to communicate a vision, and especially in Japan. Figures 7 and 8 present both percent favorable and standardized3 scores on the three elements of future vision in six economically mature markets. Company has outstanding future Senior leadership communicates a motivating vision Confidence in leadership decision making Typically, employees rate their organization’s future most favorably and rate their senior leaders’ ability to communicate a motivating vision least favorably. to make decisions and outstanding future, the regions are much more diverse. Japan falls below average, European economies (UK, Germany, and The Netherlands) are nearer to average, and United States and Australia show the highest confidence in the future. In relative terms, employees in mature markets consider their senior leaders to be doing a sub-par job when it comes to communicating a motivating vision. However, when we look at confidence in leadership Leaders in Emerging Markets Doing a Better Job Among emerging markets, there is more optimism about leaders and the future (Figures 9 and 10). In the emerging markets, we see a wider range of standardized scores (Figure 10) for the effectiveness of senior leadership conveying a motivating vision than was evident in the mature markets. Relatively speaking, emerging market leaders are being perceived more favorably in how they relate their vision; however, with the exception of South Africa, none are above their relative average, suggesting, as is the case with mature markets, leaders could be doing a better job in expressing the future vision. FIGURE 7: Future Vision in Mature Markets (percent favorable) U.S. UK Australia The Netherlands Germany Japan 90 85 80 75 70 65 60 55 50 45 40 Percent Favorable Employees in emerging markets also have greater confidence in their leaders’ decision-making ability than their mature market counterparts. They are also more likely to say that their company has an outstanding future. Although two mature markets (United States and Australia) scored above the relative average on these items, each emerging market rose above the average (see Figure 10), suggesting greater confidence and optimism in the future. Furthermore, some of the highest ratings of future vision were observed in emerging market countries–specifically South Africa, Brazil, Mexico and the UAE. Company has outstanding future Senior leadership communicates a motivating vision Confidence in leadership decision making 3To account for response sets or other country-specific biases, raw percent favorable scores were rescaled into standardized scores for each country. Standardized scores show how the three leadership items move in comparison to a global favorability score, which was estimated as the percent favorable across all items and themes in a particular country. On the standardized scale, a score of 50 reflects a country’s average percent favorable score. Any score above 50 indicates a more favorable than average view and any score below 50 indicates a less favorable than average view, both regardless of country-specific biases.
9 Big Data Helps Bust the Top Three Myths of Employee Engagement and Leadership But our intuition would be wrong. Figures 11 and 12 show scores on confidence in the company’s future are at least average or higher in all challenged countries—in Egypt the score on this item is higher than that in each mature market country. In contrast, employees in challenged markets are more critical of their senior leaders’ ability to communicate a motivating vision—the score in each country is below average. FIGURE 9: Future Vision in Emerging Markets (percent favorable) Brazil Russia China Mexico South Africa UAE 90 85 80 75 70 65 60 50 45 40 FIGURE 11: Future Vision in Challenged Markets (percent favorable)4 Percent Favorable Egypt Spain Greece 90 85 80 75 70 65 60 55 50 45 40 Company has outstanding future Senior leadership communicates a motivating vision Confidence in leadership decision making Percent Favorable FIGURE 10:Future Vision in Emerging Markets (standardized scores) Company has outstanding future Senior leadership communicates a motivating vision Brazil Russia China Mexico South Africa UAE 60 58 56 54 52 50 48 46 44 42 40 FIGURE 12: Future Vision in Challenged Markets (standardized) Percent Favorable Avg Egypt Spain Greece 60 58 56 54 52 50 48 46 44 42 40 Percent Favorable Company has outstanding future Senior leadership communicates a motivating vision Confidence in leadership decision making Avg Leaders in Hard-Hit Markets Rise to the Challenge In addition to examining emerging markets, we looked at three other markets where the macro-economic conditions are not as optimistic for various reasons: Egypt, Spain and Greece. We have called this group of countries “challenged markets.” Our intuition might lead us to expect scores in these countries to be markedly lower than scores in more economically stable countries. Company has outstanding future Senior leadership communicates a motivating vision 4Sufficient data on the item “I am confident that senior leadership is making the right decisions for the company” were not available in these countries, and was therefore excluded from analysis.
10 An IBM® Smarter Workforce Institute Report Conclusion This report has used big data to shed new light on some commonly held beliefs. Our analysis has revealed that: “...leaders cannot blame the economy for low scores if they are rated poorly.” • Employee engagement is not in the dire state that other commentators would have us believe. In fact, a large majority of countries in our big data analysis have seen a small increase in employee engagement between 2011 and 2012. The ability of senior leaders to communicate an inspiring and motivating vision is a driver of employee engagement. This is no fad, but something that demands urgent attention. Furthermore, there is a significant gap between average and top performers when it comes to employee perceptions of their leaders. There is a significant opportunity for average leaders to up their game by creating and communicating an inspiring vision. Such actions would help drive higher levels of engagement, which in turn has been linked to enhanced organizational performance. Furthermore, the trend in employee perceptions of senior leaders indicates a worrying dip in 2012 that could be an early warning signal of a future decline in employee engagement levels. Senior leaders may believe that employees’ views are heavily influenced by the economic conditions of the time, but at least when it comes to employee perceptions of leaders, there is very little correlation to the economic environment. In fact, leaders in emerging and challenged markets are usually rated more favorably by their employees than those in mature markets. n • However, these scores are still similar to (Spain) or higher than (Egypt and Greece) scores in mature market countries. In other words, despite the macro-economic challenges being faced by employees in these countries, they still rate their senior leaders as well or better than leaders in more mature markets. Perhaps the most astounding insight gathered from these analyses is the robustness of leadership effectiveness (see Figure 13), even in some of the most challenging economic situations. As presented previously in Figure 4, compared to 2008, senior leaders’ ability to inspire confidence and motivate employees towards a shared vision was rated more positively in 2009, at the peak of economic turmoil. Further, as summarized in Figure 13, compared to employees in more mature markets, like the U.S. and Australia, employees in challenged markets, like Greece and Spain, are just as happy or happier with their senior leaders’ ability to communicate a motivating vision and feel just as or more confident in their organization’s future. • Senior leaders seem to be the masters of their own fate, which is good news for them and their employees, as their efforts to lead their organizations through tumultuous times are not wasted. But by the same token, leaders cannot blame the economy for low scores if they are rated poorly. FIGURE 13: Summary of Vision and Future Ratings for Mature, Emerging and Challenged Markets Mature Emerging Challenged 60 55 53 50 51 49 Percent Favorable 46 45 40 30 20 10 0 Company has outstanding future Senior leadership communicates a motivating vision
11 Big Data Helps Bust the Top Three Myths of Employee Engagement and Leadership About WorkTrends and WorldNorms Data References AONHewitt. (2013). Trends in Global Employee Engagement. Lincolnshire, IL: Aon plc. http://www.aon.com/human-capital-consulting/thought-leadership/talent_ mgmt/2013_Trends_in_Global_Employee_Engagement.jsp WorkTrends WorkTrends is a research program begun in 1984. In its current form, WorkTrends is a multi-topic survey completed online by a sample of employees representative of a country’s working population in terms of industry mix, job type, gender, age and other key organizational and demographic variables. In most countries, survey takers must be adults who work full-time for an organization of 100 employees or more; this threshold drops to 25 employees or more in countries with smaller economies or hard-to-reach populations. The survey has over 200 items that cover a wide range of workplace issues, including senior leader and direct manager effectiveness, recognition, growth and development, employee engagement, customer orientation, quality emphasis, innovation, corporate social responsibility, workplace safety, work stress and performance confidence. In 2012, over 33,000 employees were surveyed. BlessingWhite (2013). Employee Engagement Research Report Update. Skillman, NJ: BlessingWhite, A Division of GP Strategies. http://www.blessingwhite.com/ EEE__report.asp The Corporate Executive Board Company (2013). Breakthrough Performance in the New Work Environment. Arlington, VA: CEB. http://www.executiveboard.com/ exbd/executive-guidance/2013/annual/index.page Gallup, Inc. (2013). State of the American Workplace. Washington, D.C.: Gallup, Inc. http://www.gallup.com/strategicconsulting/163007/state-american-workplace. aspx Gallup, Inc. (2010). The State of the Global Workplace. Washington, D.C.: Gallup, Inc. http://www.gallup.com/strategicconsulting/157196/state-global-workplace. aspx International Monetary Fund. IMF World Economic Database, April 2013. http:// www.imf.org/external/pubs/ft/weo/2013/01/weodata/index.aspx IBM (2013). Beyond engagement: The definitive guide to employee surveys and organizational performance. http://public.dhe.ibm.com/common/ssi/ecm/en/ low14043usen/LOW14043USEN.PDF WorldNorms The WorldNorm database contains employee engagement survey data that has been gathered from over 200 companies each year with employees in over 200 countries. These companies range in size from over 300,000 employees to as few as 200 employees (median employee size is 6,000). The current database contains over 250 million responses from approximately five million employees per year. This database has over 736 survey items that measure many important work place issues including employee engagement, employee alignment with corporate strategies, change management, communication, compensation and benefits, company culture, mission and values, customer focus, diversity, inclusion, ethics and corporate social responsibility, future vision, employee growth and development, innovation, involvement, leadership and manager effectiveness, performance management, recognition, quality products and services, safety and physical work environment, teamwork and collaboration, trust in leadership, and work/life balance. Reed, G. E. (2004). Toxic Leadership, Military Review, July-August 2004. http:// www.carlisle.army.mil/usawc/dclm/Toxic_Leadership.pdf World Bank (2013). Global Economic Prospects, Volume 7, June 2013 : Less Volatile, but Slower Growth. Washington, DC. © World Bank. https:// openknowledge.worldbank.org/handle/10986/13892 License: CC BY 3.0 IGO. Zenger, Jack. (2013). Why Gallup’s 70% Disengagement Data Is Wrong. Forbes. http://www.forbes.com/sites/jackzenger/2013/11/14/why-gallups-70- disengagement-data-is-wrong/
© Copyright IBM Corporation 2014 IBM Global Services Route 100 Somers, NY 10589 U.S.A. Produced in the United States of America February 2014 All Rights Reserved IBM, the IBM logo, ibm.com, the planet icon, WorkTrends and WorldNorms are trademarks or registered trademarks of International Business Machines Corporation in the United States, other countries, or both. These and other IBM trademarked terms are marked on their first occurrence in this information with the appropriate symbol (® or ™), indicating US registered or common law trademarks owned by IBM at the time this information was published. Such trademarks may also be registered or common law trademarks in other countries. A current list of IBM trademarks is available on the Web at ibm.com/legal/ copytrade.shtml References in this publication to IBM products or services do not imply that IBM intends to make them available in all countries in which IBM operates.