Download
1 / 9
90 likes | 132 Views
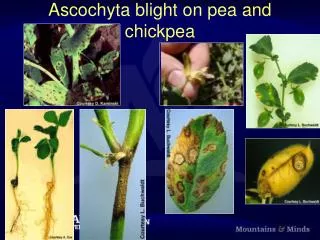
The genus Cicer comprises 9 annual species and 31 perennial species and out of 9 annuals one species is under cultivation namely Cicer arietinum. The existing genetic variability has been harnessed in plant breeding programme which further narrowed the genetic base in cultigens. Therefore, from the variation enhancement point of view, the present study has been undertaken to assess the mutagenicity of the physical and chemical agents.

E N D
American Journal of Pharmacology and Pharmacotherapeutics Original Article Some Biochemical and Biotechnological Perspectives in Wild Chickpea and its Induced Mutants Girish. C. Kamble*1 and H. J. Petkar2 1Department of Botany, Shri R. R. Lahoti Science College, Morshi (Dist-Amravati) Maharashtra State, India 2Department of Computer Science, Dr. Babasaheb Nandurkar College of Physical Education, Yeotmal, State- Maharashtra, India *Corresponding author e-mail: gckamble@yahoo.in A B S T R A C T The genus Cicer comprises 9 annual species and 31 perennial species and out of 9 annuals one species is under cultivation namely Cicer arietinum. The existing genetic variability has been harnessed in plant breeding programme which further narrowed the genetic base in cultigens. Therefore, from the variation enhancement point of view, the present study has been undertaken to assess the mutagenicity of the physical and chemical agents. The mutation breeding or mutagenesis is one of the important and useful technique and protocol to increase the mutation spectrum in the wild species which in turn could be introduced into the cultivated species to improve the qualitative and quantitative traits. SDS- PAGE electrophoresis is significance tool to assess the variation in the treated materials in form of protein profile. The seed protein profile has been studied in wild chickpea and its mutant treated with chemical and physical mutagens separately and in combination treatment and compared with the untreated parent. The analysis of the banding pattern of the control and induced mutants has been performed as per UPGMA grouping and Jaccard Similarity Coefficient. The maximum major band has been observed in the control while its mutants represent less than that of the control. The polypeptide bands shows varying size from 5.92 KDa to119.08 KDa. The genetic distance between all the 10 treatment varied from 0.333 to 0.75 as revealed by Jaccard Similarity Coefficient. The dendrogram represent one parent and 9 mutants into two major cluster in the present investigation. The induced mutants represent the deviation from the parent indicating variation when compared to the control in the present study. Keywords: Wild chickpea, SDS-PAGE electrophoresis, Jaccard similarity coefficient, Cluster analysis. American Journal of Pharmacology and Pharmacotherapeutics www.pubicon.in
Kamble et al__________________________________________________ ISSN 2393-8862 INTRODUCTION chickpea10,11, therefore the possible ways should be tried for cultigen improvement programme. MATERIAL AND METHODS The genetic advance improvement is constrained due to low level of genetic variation in cultivated chickpea and it has been identified as a recalcitrant crop. The mutation breeding, inter-specific hybridi- zation and introduction of resistance genes in cultigens from wild species could be applied as supplementary and comple- mentary technique to enhace genetic variation. The resistance genes present in the wild species could be introgressed into the cultigen in order to maximize the genetic base of the crop20. The mutation breeding technique is applied to change the quantitative and qualitative charecters of the seed protein in many crops2. The induced mutation methods are employed in plant breeding to improve varieties. The irradiation by physical mutagen leads DNA breaks in plants5. The protein electrophoretic pattern is directly associated with the genetic background used for certification of the genetic make up4. It has been reported that the induced mutation method could be used to create the additional variability which in turn, serve as a supplementary one for the existing available germplasm1. Each variety shows a specific and perticular banding pattern of protein4. The seed protein in the legume is composed of water-soluble albumin and salt soluble globulins and their proportin or ratio could be changed under the effect of mutated genes15. The protein electro- phoregram of Cicer reticulatum shows the close resemblance with that of cultigens13. The electrophoresis of the seed protein can be used as a significant and effective technique to analyze the genetic variation in plant genetic resources4. As has been reported that there has been no any significant alteration in the protein content followed by physical mutagenic treatment The seeds of wild chickpea Cicer reticulatum (Accession No.-ICC 17164 JM 2105 and ICC 17121 JM 2100) were procured from the ICRISAT, Patancheru, (Andhra Pradesh), India. The three sets of seeds were formed and the treatment of the various concentration of Sodium azide (SA) viz. 0.1%, 0.2%, 0.3%, was given to the 1st set and encoded as T2, T3, and T4 respectively. The seeds of 2nd set were treated with combination treatment of SA and X-rays radiation viz. 0.1% SA+5KR and encoded as T5, 0.2% SA+10KR encoded as T6, and 0.3% SA +15KR as T7. For the combination treatment, first healthy seeds were selected and treated with 0.1% to 0.3% SA followed by the through washing and soaking with blotting paper to remove residual effect of treating solution thereafter subjected for irradiation with different doses of radiation viz. 5KR to 15 KR X rays. The seeds of 3rd set were treated with different doses 5 KR, 10 KR, 15 KR of X-ray radiations and encoded as T8, T9, and T10 respectively while T1 as the untreated control. All the treated along with the untreated control T1, seeds were sown to raise M1 generation. The seed yield were collected as M1 electrophoresis. The seed yield collected from all the treatments was used for the protein estimation and for electrophoresic assessment. The seeds were subjected for grinding to form the seed floor The 25 mg of seed powder was added to 1ml of Protein Extraction Buffer (0.2% SDS, 0.05 M Tris -HCL, 5 M Urea and 1% β- Mercaptethanol with pH adjusted as 6.8- generation for and in chemical cultigens AJPP[2][1][2015] 041-049
Kamble et al__________________________________________________ ISSN 2393-8862 7.00) and mixed thoroughly to extract the seed storage protein and subjected to the centrifugation (15000×g) for 7 Minutes at 4oC. Supernatant was collected for further study4. The protein estimation was carried out by means of Bradford assay6. The 25 l protein extracts and 25l Laemmli buffer mixed together. The 50 µg seed protein from each treatment along parent control was mixed the sample buffer pH 6.8 (Laemmili Buffer) thereafter loaded in the gel wells. SDS- PAGE has been executed using 11.25% polyacrylamide gel at 50 mA for two and half an hour. The 2 separate gels were run to check the reproducibility. The gel was stained with 0.2% (w/v) Coomassie Brilliant Blue R- 250 for 5 hours and then destained for 24 hours14. The analysis of properly destained gels was executed with the help of gel documentation system. marker weight was loaded in the one of the gelwells along with seed protein of each treatments. The consistent bands present in the gel were taken into consideration and represented in Figure1, Figure 2, and Figure 3. The gels were analyzed as (1) for presence of particular protein band and as (0) for absence of bands shown in Table 2. The Pair wise similarities was computed using Jaccard Similarity Coefficient between the control and its induced mutants. The cluster analysis has been executed on the basis of similarity matrix using UPGMA17,9. Jaccards Coefficient Sij = nij / ni + nj - nij. Where, Sij the similarity between lanes i and j, nij the number of the similar corresponding bands for i and j, nitotal number of bands present in the lane i, njtotal number of bands present in the lane j, ni + nj - nij total number of bands present in both lane. The dissimilarity can be obtained by substracting similarity from one i.e. 1- Sij (Similarity). The clustering was performed using by UPGMA (Unweighted Pair Grouping of Mean of Arithmetic Average) Clustering Method –UPGMA3. RESULTS AND DISCUSSION The total 20 bands in the T1 treatment were observed molecular weight range between 7.94 KDa to 119.08 Kda which is in the conformity with the previous report8, whereas the qualitative and quantitative variation were observed in all other treatments T2 to T10. The total number of bands observed in the untreated and induced mutants in the present study are T1=20, T2=22, T3=22, T4=21, T5=18, T6=17, T7=20, T8=21, T9=21 and T10=19. The total 18 and 22 bands has been reported in 21 accesion of kabuli chickpea (Cicer arietinum), showing range between 5 KDa to 70 KDa by using electrophoretic study4. The intense band was described as ‘major bands’ while less intense band as ‘minor band’. The range of major band was observed from 7 to 12. 12 major bands were observed in the control treatment while 7 to 11 was observed in the mutants while rests of the bands were minor band. The increase in the protein content has been reported in Phaseolus by using the mutagenic treatment and mutation breeding16. There has been no any significant change in the seed protein content of mutant in the cultivated chickpea10,11,21. The polypeptide bands of different sizes ranging from 5.92 KDa to119.08 KDa were observed in all the treatments alongwith the untreated control. Pairwise similarity between parent and mutants has been derived on the basis of Jaccard’s coefficient ranged between 0.333 to 1.0 with a mean of 0.619 represented in Table 1. Figure dendrogram obtained (Unweighted Pair Group Method using Arithmetic Average Method) clustering of similarity matrix; similar observation has representing The molecular 4 represents by the UPGMA AJPP[2][1][2015] 041-049
Kamble et al__________________________________________________ ISSN 2393-8862 been mentioned in Solanum melanogena L. and its wild species9. Tallbery18,19 confirmed that the change in protein composition is owing to the mutated genes. Protein and their respective pattern with regards to appearance of new bands and disappearance of old band and relative mobility and colouration of band in mutants confirm alteration in polypeptides of seed protein due to gene mutation7. The protein profiling of the seed storage protein has been reported as one of the potential methods to differentiate the parents and mutants1. Jaccard Coefficient was computed on the basis of Unweighted Pair Group Method by Arithematic Mean (UPGMA). Some polypeptide band is present in its mutants while absent in parent control treatment. The mutants were polymorphic as compared to other mutants in M1 generation. Similar observation has been reported in Chrysanthemum12. Genetic distance between all 10 treatments varied from 0.333 to 0.75 as reveled by Jaccard similarity coefficient. Similar observation has been reported in Chrysanthemum and its radio-mutants12 in wild chickpea and its induced mutants treated with physical and chemical mutagens independently and in combination8. The observed in the banding pattern in the present investigation. The dendrogram derived with the help of Jaccard similarity coefficient by using UPGMA method which shows one control parent and its induced 9 mutant into two major clusters. The first cluster consists of T1 and seven induced mutants T5, T2, T3, T4, T8, T9, T10, and the second cluster consists of mutants T6, T7. The second cluster shows protein diversity from parents and other mutants in M1 generation and depicted in the Figure 4. TheSDS-PAGE Electrophoresis of seed storage proteins could be employed for the assessment of the genetic variation relative to germplasm and also to distinguish the mutants from their parent genotypes1. CONCLUSION The chemical and physical mutagen showed the potential to cause the mutation in the wild chickpea. The SDS-PAGE electrophoretic protein profile in M1 generation represented the polymorphism in the banding pattern as compared to the control treatment. The variation was observed between control and its induced mutants. The SDS-PAGE electrophoretic pattern of the induced mutants represented the deviation from its untreated control parent with respect to the Jaccards similarity coefficient in the presentBiochemical and Biotechnological assessment study. The second cluster shows more protein diversity from parents and other mutants. ACKOWLEDGEMENT The authors are very much thankful and grateful to the UGC, New Delhi for providing financial assistance for the present study and due sincere thank to ICRISAT, Patancheru (AP) India for supplying the wild germplasm to the present study. The authors expressed thank to the department of botany for providing equipment facilities for the present study. REFERENCES polymorphism was laboratory and 1.Amjad Hameed, Tariq Mahmud Shash, Babar Manzoor Atta, Nayyer Iqbal, M. Ahsanul Haq and Hina Ali, “Comparative seed storage protein profiling of kabuli chickpea genotypes”, Pak. J. Bot. 41(2): pp. 703-710, 2009. 2.Amrishahi, M. C. and Tavakoli, M., “Protein content of different varieties of five species of rules Crops. Improving plant protein by nuclear Techniques” (Proc. Symp. Vinna, 1970) I.A.E.A. Vienna: pp. 331-333, 1970. AJPP[2][1][2015] 041-049
Kamble et al__________________________________________________ ISSN 2393-8862 3.Arjen Van Ooyen, Theoretical aspects pattern analysis (Netherland Institute for Brain Research Meibergdreef 33, 1105AZ Amsterdam, The Netherlands) In: New Approaches for Generation and Analysis of Microbial Fingerprints (Eds: L. Dijkshoom, K. J. Tower and M. Struelens) Elsevier, Amsterdam. pp. 31-45, 2001. Website:- http://www.anc.ed.ac.uk/arjen. 4.Asghar, R., Siddique, T. and Afzal, M., “Inter and intra-specific variation in SDS- PAGE electrophorograms of total seed protein in chickpea (Cicer arietinum L.) Germplasm”, Pak J. Biol. Sci. 6 (24): pp. 1991-1995, 2003. 5.Atak Cimen, Ozge Celik and Leyla Acik, “Genetic Analysis Mutants Using Polymorphic DNA (RAPD)”, Pak. J. Bot., 43 (2): pp. 1173-1182, 2011. 6.Bradford, Marion M., “A Rapid and Sensitive Method for the Quantitation of Microgram Quantities of Protein Utilizing the Principle of Protein-Dye Binding”, Analytical Biochemistry 72: pp. 248-254, 1976. 7.Gottschalk, W. and Wolff, G., Induced mutation in plant breeding Monograph on Theoretical and Applied Genetics Springer, Verlag Berlin Heildeberg, NewYork Tokyo, 1983. 8.Kamble, G. C. “Comparative protein profiling study in wild chickpea and its induced mutants”, The Experiment, 18 (4): pp.1297-1303, 2014. 9.Karihaloo, J. L., Manjeet Kaur and Sonika Singh, “Seed protein diversity in Solanum melongena L. and its wild and weedy Relatives”, Genetic Resources and Crop Evolution 49: pp. 533–539, 2002. 10.Kharkwal, M. C., “Induced mutations for improvement of protein in chickpea (Cicer arietinum L.)”, Indian J. Genet. 58: pp. 61- 68, 1998 a. 11.Kharkwal, M. C., “Induced mutations in chickpea (Cicer Comparative mutagenic effectiveness and effuciency of physical and chemical mutagens”, Indian J. Genet. 58: pp.159-167, 1998 b. 12.Kumar, S., Prasad, K. V., Chaudhary, M. L., “Detection of genetic variability among Chrysanthemum radiomutants using RAPD markers”, Current Science, 90 (8): pp. 1108 - 1113, 2006. 13.Ladizinsky, G. and Adler, A., “The origin of chickpea as indicated by seed protein electrophoresis”. Israel J. Bot. 24: pp. 183- 189, 1975. 14.Laemmli, U. K., “Cleavage of structural proteins during the assembly of the head of bacteriophage T4”, Nature. 227: pp. 680- 685, 1970. 15.Myers, J. R. and Gritton, E. T., “Genetic male sterility in the Pea. 1. Inheritance allilism and linkage”, Euphytica. 38: pp. 165-174, 1988. 16.Prasad, A. B., Verma, N. P., Jha, H. M., Seed protein content and protein pattern in gamma ray induced Phaseolus mutant. In: Mutagenesis Basics and Applied Ed. A. B. Prasad, Print House (India), Lucknow: pp. 158-184, 1986. 17.Sneath, P. H. A. and Sokal, R. R., Numerical Taxonomy, SanFrascisco: W. H. Freeman, 1973. 18.Tallberg, A., “Protein and lysine content in high lysine double-recessive of barley I. Combination between mutant 1508 and Hiproly backcross”, Hereditas. 94: pp. 253- 260, 1981a. 19.Tallberg, A., “Protein and lysine content in high lysine double-recessive of barley II. Combination between mutant 7 and a Hiproly backcross”, Hereditas. 94: pp. 261- 268, 1981b. 20.Van Rheenen, H.A., Pundir, R. P. S. And Miranda, J. H., “How to accelerate the genetic improvement of a recalcitrant crop species such as chickpea”, Current Science 65: pp. 414-417, 1993. 21.Wani, A. A. and Anis, Mohammad, “Gamma Ray- and EMS-Induced Bold- Seeded High-Yielding Mutants in Chickpea (Cicer arietinum L.)”, Turk. J. Biol. 32: pp. 161-166, 2008. of Rhododendron Amplified Random and Patil, A. S., arietinum L.). I AJPP[2][1][2015] 041-049
Kamble et al__________________________________________________ ISSN 2393-8862 Table 1. Similarity Matrix in M1 generation of wild chickpea and its induced mutants. (Cicer reticulatum L.) T1 1 T2 0.68 1 T3 0.68 0.629 1 T4 0.64 0.592 0.72 1 T5 0.727 0.538 0.538 0.625 1 T6 0.48 0.392 0.392 0.407 0.521 T7 0.6 0.448 0.448 0.464 0.583 T8 0.576 0.482 0.535 0.615 0.5 T9 0.576 0.592 0.592 0.615 0.5 T10 0.625 0.413 0.464 0.481 0.48 6.584 5.086 4.689 4.207 3.584 T1 T2 T3 T4 T5 1 0.541 0.407 0.357 0.333 2.638 T6 1 0.518 0.518 0.444 2.48 T7 1 0.75 0.538 2.288 T8 1 0.538 1.538 T9 1 1 T10 34.094 55 Table 2. Polypeptide bands observed in control wild Chickpea and its induced mutants in M1 generation. (Cicer reticulatum L.) S. No. Molecular Weight in KDa T1 T2 T3 T4 T5 T6 T7 T8 T9 T10 1 2 3 4 5 6 7 8 9 10 11 12 13 14 15 16 17 18 19 20 21 119.08 110.22 109.12 108.92 107.53 96.56 85.32 84.91 83.97 81.73 73.01 68.47 65.75 60.19 59.21 58.18 56.45 54.31 52.39 44.77 39.31 1 0 1 0 0 1 0 0 1 0 1 0 1 0 0 1 0 0 1 1 0 1 0 0 1 0 1 1 0 0 0 1 0 1 0 0 1 0 0 1 1 0 1 0 0 0 0 1 0 1 0 0 1 0 1 0 0 1 0 0 1 1 0 1 0 0 0 1 1 0 1 0 0 1 0 1 0 0 1 0 0 1 1 0 1 0 1 0 0 1 0 0 1 0 1 0 1 0 0 0 0 0 1 1 1 1 1 0 0 0 1 0 0 1 0 0 1 0 1 0 1 0 0 1 1 1 1 1 0 0 0 1 1 0 1 0 1 0 1 0 1 1 0 0 1 1 1 1 1 0 0 0 0 0 0 1 1 1 0 1 0 0 1 0 1 1 1 0 1 0 0 0 0 0 1 0 0 0 1 0 1 0 0 1 0 1 1 1 0 1 0 1 0 0 1 0 0 1 0 1 0 0 0 0 1 1 0 0 1 0 AJPP[2][1][2015] 041-049
Kamble et al__________________________________________________ ISSN 2393-8862 22 23 24 25 26 27 28 29 30 31 32 33 34 35 36 37 38 39 40 41 42 38.26 36.96 36.35 34.45 32.07 31.02 28.43 24.72 23.11 22.71 19.7 16.54 15.66 14.13 13.01 11.87 9.62 7.94 6.52 5.92 Total 1 0 0 1 0 1 1 1 0 0 1 1 0 1 0 1 1 1 0 0 20 1 0 0 1 1 1 0 1 0 0 1 1 0 1 1 1 1 1 0 1 22 1 0 1 1 0 1 0 1 0 0 1 1 1 1 1 1 1 1 1 0 22 1 1 0 1 0 1 0 1 0 1 1 1 0 1 0 1 1 0 1 0 21 1 0 0 1 0 1 0 1 0 1 1 1 0 1 0 0 1 0 0 0 18 1 0 0 0 0 1 0 1 1 0 0 1 0 1 0 0 1 0 0 0 17 1 0 0 1 0 0 1 0 1 0 1 1 0 1 0 0 1 0 0 0 20 1 1 0 1 0 1 0 0 0 1 1 1 1 1 0 1 1 0 0 0 21 1 1 0 1 0 1 0 0 1 1 1 1 1 1 0 1 1 1 0 0 21 1 1 0 1 0 0 1 0 0 1 0 1 1 1 0 1 1 1 0 0 19 Figure 1. Gel showing the banding pattern AJPP[2][1][2015] 041-049
Kamble et al__________________________________________________ ISSN 2393-8862 Figure 2. Gel showing the banding pattern Figure 3. Gel showing the banding pattern AJPP[2][1][2015] 041-049
Kamble et al__________________________________________________ ISSN 2393-8862 Figure 4. Dendrogram based on Jaccards Similarity Coefficient of Seed Protein in Wild Control Parent and its induced Mutants by using UPGMA in M1 Generation AJPP[2][1][2015] 041-049