Download
1 / 7
70 likes | 80 Views
Diabetes Mellitus is considered as one of the five leading causes of death in the world. Apart from currently available therapeutic options, many herbal medicines have been recommended for the treatment of diabetes. Traditional plant medicines are used throughout the world for a range of diabetic presentations

E N D
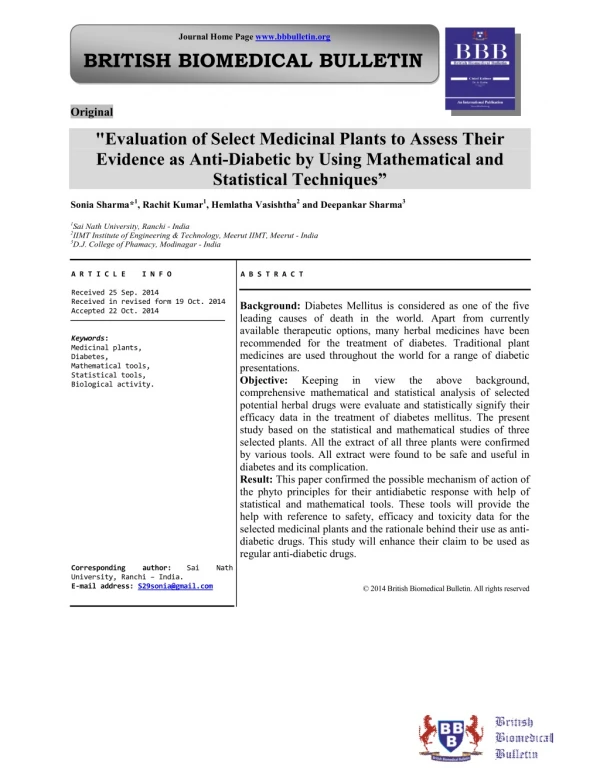
Journal Home Page www.bbbulletin.org BRITISH BIOMEDICAL BULLETIN Original "Evaluation of Select Medicinal Plants to Assess Their Evidence as Anti-Diabetic by Using Mathematical and Statistical Techniques” Sonia Sharma*1, Rachit Kumar1, Hemlatha Vasishtha2 and Deepankar Sharma3 1Sai Nath University, Ranchi - India 2IIMT Institute of Engineering & Technology, Meerut IIMT, Meerut - India 3D.J. College of Phamacy, Modinagar - India A R T I C L E I N F O Received 25 Sep. 2014 Received in revised form 19 Oct. 2014 Accepted 22 Oct. 2014 Keywords: Medicinal plants, Diabetes, Mathematical tools, Statistical tools, Biological activity. Corresponding author: Sai University, Ranchi – India. E-mail address: S29sonia@gmail.com A B S T R A C T Background: Diabetes Mellitus is considered as one of the five leading causes of death in the world. Apart from currently available therapeutic options, many herbal medicines have been recommended for the treatment of diabetes. Traditional plant medicines are used throughout the world for a range of diabetic presentations. Objective: Keeping in view comprehensive mathematical and statistical analysis of selected potential herbal drugs were evaluate and statistically signify their efficacy data in the treatment of diabetes mellitus. The present study based on the statistical and mathematical studies of three selected plants. All the extract of all three plants were confirmed by various tools. All extract were found to be safe and useful in diabetes and its complication. Result: This paper confirmed the possible mechanism of action of the phyto principles for their antidiabetic response with help of statistical and mathematical tools. These tools will provide the help with reference to safety, efficacy and toxicity data for the selected medicinal plants and the rationale behind their use as anti- diabetic drugs. This study will enhance their claim to be used as regular anti-diabetic drugs. the above background, Nath ©2014 British Biomedical Bulletin. All rights reserved
Sharmaet al____________________________________________________ ISSN-2347-5447 Introduction Epidemiology is the science that studies the patterns, causes, and effects health and disease conditions in defined populations. It is used to cover the description and causation of epidemic disease also non-disease health-related conditions, such as diabetes, high blood pressure and obesity. Epidemiology is based on how the pattern of the disease cause changes in the function of everyone. Statistics is the science of obtaining and it deals with the data including the planning of data collection in terms of the design of surveys and experiments. Mathematical techniques of statistics has been became a united with the art and individuality of medicine, providing indispensable tools for the design1. Whereas Biostatistics is developed from the application of statistics in various research aspects i.e. biology, biomedical care, and public health. It plays an important role understanding, and describing the overall health and well-being of a population. Diabetes Mellitus is a multiple syndromes which is characterized by hyperglycemia, altered metabolism of lipids, carbohydrates and proteins and a risk of complications from vascular disease. It can be classify clinically as either type I diabetes or IDDM (insulin dependent diabetes) and type II diabetes or NIDDM (non-insulin dependent diabetes)2. The objectives were based on to assess their evidence as anti- diabetic by using statistical techniques. Materials and Methods results. Also ask for the manuscript. Finally various statistical and mathematical tools were applied to confirmed their evidence as anti-diabetic. Data sources, search strategy, and selection criteria A systematic review of the published literature were carried out using the suitable search strings in the following data sources: Google, MEDLINE Biological and Chemical Abstracts, global health, National Science Library and the reference books. Search terms shall include but not limited to the key words viz. Name of the medicinal antioxidant, free radical scavenging, anti- hyperlipidemic, etc. After the selections of plants were tools were selected to judge their activity. Result (via PUBMED), plant, antidiabetic, in measuring, Hypothesis Let us take the nullhypothesis that there is no change in Blood Glucose. (See table 1.) Probabilistic approach of effect of H. isora on blood glucose tolerance The diabetes recovery model from Khajehnasiri et al. divides the diabetes rats (N (t)) into the following sub-groups: diabetes individuals (Di (t)), diabetes individuals Treated with plant extract (TPT (t)) and have recovered from Diabetes (RD (t)). Thus, the total variable diabetic population size at time t is given by, N (t) = Di (t) + (TPT (t)) + (RD (t)). It is assumed that diabetic rats are recruited into the population at per capita rate ᴧ.The model parameters incorporated are μ (the natural mortality rate) and λ (the probability of diabetic rats. Hence, d (Di (t)) _______= ᴧ- λD- μ D dt mathematical and Selection of the plant In the present study all the three plants were selected on the basis of literature review. The original authors who have carried out the pre-clinical research work for the selected potential medicinal plants were communicated for providing the data and BBB[2][4][2014]622-628
Sharmaet al____________________________________________________ ISSN-2347-5447 The population of diabetic rats individuals is generated at the rate λ. This population is decreased by death due to natural mortality, recovery rats, severely disabled and which disability cannot be cured α, v, ᴧ and μ, respectively. Hence, d (TPT (t)) ________= λ Di (t) - α (TPT (t)) - v (TPT (t)) dt - μ (TPT (t)) Finally, the recovered population is increased by diabetic rats treated who recovered at the rate α and decreases by the natural mortality at the rate μ. Thus, d(RD (t)) _______= α (TPT (t)) – μ (RD (t)) dt In summary, d (Di (t)) _______= ᴧ- λ Di (t) - μ Di (t)---------------(1) dt d (TPT (t)) ________= λ Di (t) - α (TPT (t)) - v (TPT (t)) dt - μ (TPT (t))-----------------(2) d (RD (t)) _______= α (TPT (t)) – μ (RD (t))------------(3) dt Hence the control representing the level of efforts on prevention and recovery, the models 1, 2 and three becomes d (Di (t)) _______= ᴧ- λ (1-u1 (t)) Di (t)-μ Di (t)----(4) Dt d (TPT (t)) ________= λ (1-u1 (t)) Di (t) - α u2 (t) – (v + dt μ) (TPT (t))---------(5) d (RD (t)) _______= α (TPT (t))-μ (RD (t))--------------(6) dt The control functions, u1 (t) and u2 (t) are bounded, Lebesgue integrable functions. The control, (1− μ 1(t)), represents the effort on prevention of diabetic rats having diabetes to reduce the number of diabetic individuals. While the control μ 2(t) is the effort on recovery from diabetes to increase the number of recovered individuals. Thus, the total variable diabetic population size at time t is given by, N (t) = Di (t) + (TPT (t)) + (RD (t)). 30=12+12+6. Hence, 0= ᴧ- 12 λ –12 µ 0=12 λ –12 α-12v-12 µ 0=12 α-6 µ From equation 1, 2 and 3 0= ᴧ- 12 λ –12 µ 0=12 λ –12 α-12v-12 µ 0=12 α-6 µ From Equation 4, 5 and 6 we get, 0= ᴧ- λ (1-u1 (t)*12-12 µ 0= λ (1-u1 (t)*12- α u2 (t)*12-(v + µ)*12 0= α u2 (t)*12+ u1 (t)*6-6 µ From the equation it has been confirmed that the value which were assumed for the study and the partial differential equation comes for the probabilistic approach in diabetes. Hence the assumed values confirmed our data. In conclusion, our optimal results show how recovery in H. isora may reduce the number of diabetes. Hypothesis Let us take the nullhypothesis that there is no change in Blood Glucose Tolerance. (See table 2.) Hypothesis Let us take the nullhypothesis that there is no change in Blood Glucose Tolerance. (See table 3.) Survival analysis For the survival percentage was calculated according to the formula (See figure 2). Survival analysis= (T-C)*100/C Where T= Treated animals. The present study based on the statistical and mathematical studies of three selected plant. Keeping in view the above background, comprehensive analysis of selected potential extracts were carried out to evaluate and statistically signify analysis the statistical BBB[2][4][2014]622-628
Sharmaet al____________________________________________________ ISSN-2347-5447 their efficacy data in the treatment of diabetes mellitus3-7. The efficacy data of the selected medicinal plants were applied to critical statistical tools for their anti-diabetic activity. The statistical and mathematical analysis were carried out for the antidiabetic selected medicinal plants. In decision analysis (Fig 1), a decision tree and the closely related influence diagram were used for the determination of oral glucose test in different plant extract with analytical decision support tool, and the expected values were calculated on the basis of various tools in different plant extracts. In decision analysis, a decision tree and the closely related influence diagram were used for the analytical decision support tool, and the expected values were calculated on the basis of various tools in different plant extracts. The different extract of H. isora, C. attenuata and P. oleracea were also tested for anti-diabetic activity, earlier by glucose tolerance test. And this hypothesis confirmed by T-test. The oral glucose tolerance test (OGTT) measures the body's ability to use a type of sugar, called glucose that is the body's main source of energy. The extract (100mg/kg and 250mg/kg) prevented the increase in blood glucose levels significantly after glucose load in three selected medicinal plants. The maximum glucose tolerance was noted for H. isora extract at the 90th min after glucose loading followed by P. oleracea and C. attenuata and is comparable with tolbutamide activity by t-test (Table 1, 2, and 3) probabilistic equation and finally this was confirmed by recovery percentage (Fig 2). In the plants H. isora, P. oleracea and C. attenuata it was found that the calculative value of the t-test at 1 % level of significance is less than table value of t test at 1 % level of significance. Conclusion plants on the basis of various statistical and mathematical tools. Moreover, this work will enhance the possible mechanism of action of the various extract for their pharmacological response with help of statistical and mathematical tools. These tools will also help in safety, efficacy and toxicity of selected medicinal plants and the rationale behind their use as anti-diabetic drugs. These tools will enhance their claim to be used as regular anti- diabetic drugs. References 1. Srivastava, M. Abbas and S.K. Mandal Statistical Evaluation of Biological' Activity of Plant Based Products: Anti-diabetic Screening 2004. 2. Stephan ND, Daryl KG. Goodman and Gilman’s The Pharmacological basis of Therapeutics. In: Hardman JG, Limbird LE, editors. Goodman Pharmacological basis of Therapeutics. 10th ed. Mc Graw - Hill: New York; 2001. pp. 1686–7. 3. Alok S, M. vijayakumar, Gaurav K, M.K. Unnikrishnan and Ch. V. Rao (2012). antihyperglycemic and antioxidant potential of polysaccharide fraction from portulaca oleracea seeds against induced diabetes Biochemistry 36, 378–382. 4. Alok S, M. Vijayakumar, Arti Raj verma, Talib Md., Unnikrrishnan M.K., Ch. V. Rao, 2009. “In Vitro α Amylase Inhibition and Antihyperglycemic Activity of H. isora in Streptozotocin- Induced Rats”. International Journal of Pharmaceutical and Clinical research 1 (1):15- 18. 5. Alok S, M. Vijayakumar, Ch. V. Rao, M.K. Unnikrishnan, and G.D. Reddy 2009. “Action of Portulaca oleracea against Streptozotocin-Induced Oxidative Stress in Experimental Diabetic Rats”. Journal of Complementary and Integrative Medicine 6(1): 1-10. 6. Pradeep Kumar, Alok Sharma, Paresh Varshney, Chandana Venkateswara Rao Antidiabetogenic and antioxidant effects of and Gilman’s The streptozotocin- rats. J. in Food The present study identifies and confirmed the active extract(s) responsible for the anti-diabetic activity of selected medicinal BBB[2][4][2014]622-628
Sharmaet al____________________________________________________ ISSN-2347-5447 Caralluma streptozotocin induced diabetes in rats. Journal of Pharmacy Research, Volume 7, Issue 3, March 2013, Pages 257–262. Alok sharma, M. vijayakumar, Gaurav kaithwas, M. k. unnikrishnan and Ch. V. Rao attenuata extract on antihyperglycemic and antioxidant potential of polysaccharide fraction from Portulaca oleracea seeds against induced diabetes in Biochemistry Willey, 36 (2012) 378–382. streptozotocin- rats, J. Food 7. Table 1. Effect of H. isora on glucose tolerance by t-test (D-D1)*(D- D1) 196.3361 411.1973 737.0139 114.3189 516.2893 1975.155 Treatment Basic value 90 mins D D1 D-D1 Normal Control 78.99 79.25 80.62 79.03 64.48 80.16 114.71 122.95 83.52 56.94 1.17 35.46 42.33 4.49 -7.54 75.91 -14.012 20.278 27.148 -10.692 -22.722 0 Treatment (100mg/kg) Treatment (250 mg/kg) Tolbutamide 15.182 S T 22.22136067 1.527718511 4 D.F Table value of t at 1% level of significance is 4.6.calculative value of t < table value of t. Hence the hypothesis hold true. There is no change in Blood Glucose. Table 2. Effect of P. oleracea on glucose tolerance by t-test (D-D1)*(D- D1) 124.1887 560.0796 196.7287 32.99354 432.8064 1346.797 Treatment Basic value 90 mins D D1 D-D1 Normal Control 79.12 79.91 82.42 81.03 66.41 81.11 116.71 109.58 88.42 58.74 1.99 36.8 27.16 7.39 -7.67 65.67 -11.144 23.666 14.026 -5.744 -20.804 0 Treatment (100mg/kg) Treatment (150 mg/kg) Tolbutamide 13.13 S T 18.34937 1.600519 4 D.F Table value of t at 1% level of significance is 4.6.calculative value of t < table value of t. Hence the hypothesis hold true. There is no change in Blood Glucose Tolerance. BBB[2][4][2014]622-628
Sharmaet al____________________________________________________ ISSN-2347-5447 Table 3. Effect of C. attenuata on glucose tolerance by t-test (D-D1)*(D- D1) 175.0329 343.7316 53.4361 96.2361 503.1049 1171.542 Treatment Basic value 90 mins D D1 D-D1 Normal Control 79.25 81.28 84.53 80.23 64.48 80.91 114.71 106.73 104.93 56.94 1.66 33.43 22.2 24.7 -7.54 74.45 -13.23 18.54 7.31 9.81 -22.43 0 Treatment (100mg/kg) Treatment (150 mg/kg) Tolbutamide 14.89 S T 17.1139 1.9455 4 D.F Table value of t at 1% level of significance is 4.6.calculative value of t < table value of t. Hence the hypothesis hold true. There is no change in Blood Glucose Tolerance. Treatment Recovery Blood Glucose t-test 100mg/kg Selection Plant extract Recovery 150 mg/kg Decision Node Event Mode End Mode Figure 1. Decision tree for the oral glucose test in different plant extracts BBB[2][4][2014]622-628
Sharmaet al____________________________________________________ ISSN-2347-5447 Figure 2. Survival analysis in three selected plants with OGTT parametres BBB[2][4][2014]622-628