Download
1 / 47
500 likes | 934 Views
Chapter 8 Skeletal Muscle: Structure and Function. EXERCISE PHYSIOLOGY Theory and Application to Fitness and Performance, 6th edition Scott K. Powers & Edward T. Howley. Skeletal Muscle. Human body contains over 400 skeletal muscles 40-50% of total body weight Functions of skeletal muscle

E N D
Chapter 8Skeletal Muscle: Structure and Function EXERCISE PHYSIOLOGY Theory and Application to Fitness and Performance, 6th edition Scott K. Powers & Edward T. Howley
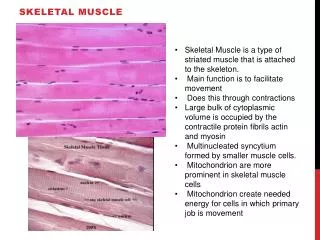
Skeletal Muscle • Human body contains over 400 skeletal muscles • 40-50% of total body weight • Functions of skeletal muscle • Force production for locomotion and breathing • Force production for postural support • Heat production during cold stress
Connective Tissue Covering Skeletal Muscle • Epimysium • Surrounds entire muscle • Perimysium • Surrounds bundles of muscle fibers • Fascicles • Endomysium • Surrounds individual muscle fibers
Microstructure of Skeletal Muscle • Sarcolemma • Muscle cell membrane • Myofibrils • Threadlike strands within muscle fibers • Actin (thin filament) • Myosin (thick filament) • Sarcomere • Includes Z-line, M-line, H-zone, A-band, I-band • Sarcoplasmic reticulum • Storage sites for calcium • Transverse tubules
Microstructure of Skeletal Muscle Figure 8.2
The Sarcoplasmic Reticulum and Transverse Tubules Figure 8.3
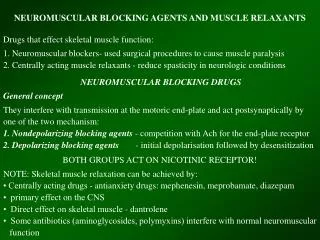
The Neuromuscular Junction • Junction between motor neuron and muscle fiber • Motor end plate • Pocket formed around motor neuron by sarcolemma • Neuromuscular cleft • Short gap between neuron and muscle fiber • Acetylcholine is released from the motor neuron • Causes an end-plate potential (EPP) • Depolarization of muscle fiber
The Neuromuscular Junction Figure 8.4
Muscular Contraction • The sliding filament model • Muscle shortening occurs due to the movement of the actin filament over the myosin filament • Formation of cross-bridges between actin and myosin filaments • Power stroke • Reduction in the distance between Z-lines of the sarcomere
The Sliding Filament Theory Figure 8.5
The Relationships Among Troponin, Tropomyosin, Myosin, and Calcium Figure 8.6
Energy for Muscle Contraction • ATP is required for muscle contraction • Myosin ATPase breaks down ATP as fiber contracts • Sources of ATP • Phosphocreatine (PC) • Glycolysis • Oxidative phosphorylation
Sources of ATP for Muscle Contraction Figure 8.7
Excitation-Contraction Coupling • Depolarization of motor end plate (excitation) is coupled to muscular contraction • Action potential travels down T-tubules and causes release of Ca+2 from SR • Ca+2 binds to troponin and causes position change in tropomyosin • Exposing active sites on actin • Strong binding state formed between actin and myosin • Contraction occurs
Steps Leading to Muscular Contraction Figure 8.10
Muscle Fatigue • Decrease in muscle force production • Reduced ability to perform work • Contributing factors: • High-intensity exercise (~60 sec) • Accumulation of lactate, H+, ADP, Pi, and free radicals • Long-duration exercise (2–4 hours) • Muscle factors • Accumulation of free radicals • Electrolyte imbalance • Glycogen depletion • Central Fatigue • Reduced motor drive to muscle from CNS
Muscle Fatigue Figure 8.8
Characteristics of Muscle Fiber Types • Biochemical properties • Oxidative capacity • Number of capillaries, mitochondria, and amount of myoglobin • Type of myosin ATPase • Speed of ATP degradation • Contractile properties • Maximal force production • Force per unit of cross-sectional area • Speed of contraction (Vmax) • Myosin ATPase activity • Muscle fiber efficiency
Characteristics of Individual Fiber Types • Type IIx fibers • Fast-twitch fibers • Fast-glycolytic fibers • Type IIa fibers • Intermediate fibers • Fast-oxidative glycolytic fibers • Type I fibers • Slow-twitch fibers • Slow-oxidative fibers
Characteristics of Muscle Fiber Types Table 8.1
Comparison of Maximal Shortening Velocities Between Fiber Types Figure 8.12
Type I Type IIa Type IIx Histochemical Staining of Fiber Type Figure 8.11
Fiber Types and Performance • Nonathletes • Have about 50% slow and 50% fast fibers • Power athletes • Sprinters • Higher percentage of fast fibers • Endurance athletes • Distance runners • Higher percentage of slow fibers
Exercise-Induced Changes in Skeletal Muscles • Strength training • Increase in muscle fiber size (hypertrophy) • Increase in muscle fiber number (hyperplasia) • Endurance training • Increase in oxidative capacity • Alteration in fiber type with training • Fast-to-slow shift • Type IIx IIa • Type IIa I with further training • Seen with endurance and resistance training
Effects of Endurance Training on Fiber Type Figure 8.13
Muscle Atrophy Due to Inactivity • Loss of muscle mass and strength • Due to prolonged bed rest, limb immobilization, reduced loading during space flight • Initial atrophy (2 days) • Due to decreased protein synthesis • Further atrophy • Due to reduced protein synthesis • Atrophy is not permanent • Can be reversed by resistance training • During spaceflight, atrophy can be prevented by resistance exercise
Age-Related Changes in Skeletal Muscle • Aging is associated with a loss of muscle mass • 10% muscle mass lost between age 25–50 y • Additional 40% lost between age 50–80 y • Also a loss of fast fibers and gain in slow fibers • Also due to reduced physical activity • Regular exercise training can improve strength and endurance • Cannot completely eliminate the age-related loss in muscle mass
Types of Muscle Contraction • Isometric • Muscle exerts force without changing length • Pulling against immovable object • Postural muscles • Isotonic (dynamic) • Concentric • Muscle shortens during force production • Eccentric • Muscle produces force but length increases
Muscle Actions Type of exercise Muscle Muscle Action Length Change _________________________________________________ Dynamic Concentric Decreases Eccentric Increases Static Isometric No Change Table 8.3
Isometric and Isotonic Contractions Figure 8.14
Speed of Muscle Contraction and Relaxation • Muscle twitch • Contraction as the result of a single stimulus • Latent period • Lasting ~5 ms • Contraction • Tension is developed • 40 ms • Relaxation • 50 ms • Speed of shortening is greater in fast fibers • SR releases Ca+2 at a faster rate • Higher ATPase activity
Muscle Twitch Figure 8.15
Force Regulation in Muscle • Force generation depends on: • Types and number of motor units recruited • More motor units = greater force • Fast motor units = greater force • Initial muscle length • “Ideal” length for force generation • Increased cross-bridge formation • Nature of the neural stimulation of motor units • Frequency of stimulation • Simple twitch • Summation • Tetanus
Relationship Between Stimulus Strength and Force of Contraction Figure 8.16
Length-Tension Relationships in Skeletal Muscle Figure 8.17
Simple Twitch, Summation, and Tetanus Figure 8.18
Force-Velocity Relationship • At any absolute force the speed of movement is greater in muscle with higher percent of fast-twitch fibers • The maximum velocity of shortening is greatest at the lowest force • True for both slow and fast-twitch fibers
Muscle Force-Velocity Relationships Figure 8.19
Force-Power Relationship • At any given velocity of movement the power generated is greater in a muscle with a higher percent of fast-twitch fibers • The peak power increases with velocity up to movement speed of 200-300 degrees•second-1 • Power decreases beyond this velocity because force decreases with increasing movement speed
Muscle Force-Power Relationships Figure 8.20
Receptors in Muscle • Provide sensory feedback to nervous system • Tension development by muscle • Account of muscle length • Muscle spindle • Golgi tendon organ
Muscle Spindle • Responds to changes in muscle length • Consists of: • Intrafusal fibers • Run parallel to normal muscle fibers (extrafusal fibers) • Gamma motor neuron • Stimulate intrafusal fibers to contract with extrafusal fibers (by alpha motor neuron) • Stretch reflex • Stretch on muscle causes reflex contraction • Knee-jerk reflex
Muscle Spindles Figure 8.21
Golgi Tendon Organ (GTO) • Monitor tension developed in muscle • Prevents muscle damage during excessive force generation • Stimulation results in reflex relaxation of muscle • Inhibitory neurons send IPSPs to muscle fibers
Golgi Tendon Organ Figure 8.22