Download
1 / 63
660 likes | 859 Views
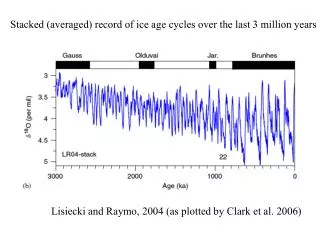
Stacked (averaged) record of ice age cycles over the last 3 million years. Lisiecki and Raymo, 2004 (as plotted by Clark et al. 2006). Summary Plio-Pleistocene Ice Cycles.

E N D
Stacked (averaged) record of ice age cycles over the last 3 million years Lisiecki and Raymo, 2004 (as plotted by Clark et al. 2006)
Summary Plio-Pleistocene Ice Cycles • One school maintains that ice sheet behavior evolved as a result of gradual drift toward cooler climate (greenhouse gas induced?). According to this logic, the early Pleistocene, ice sheet waxing/waning was restricted to high latitudes, where integrated summer insolation is dominated by 41 k variability (Huybers, Tziperman, etc.) • Another school argues that ice sheets always responded on 23 kyr timescales as well, but that the signal was simply “cancelled” by opposite phased behavior in the north/south poles (Raymo) • The 100 kyr variability of marine d18O can viewed EITHER as a signal of deep ocean temperature variability (Shackleton) OR as the result of non-linearities in large ice sheet dynamics (Clark et al.). Note that carbon cycle variability plays a role in all these ideas. Makes it imperative to obtain a quantitative CO2 record through the Plio-Pleistocene. These ideas are all ice sheet centric.
Summary Plio-Pleistocene Ice Cycles • What do we know about either CO2 OR other aspects of the climate system through the major transitions of the Plio-Pleistocene? ----Greenhouse gases may be coming, if old enough ice on Antarctica can be found. -----There is some evidence from the tropical ocean/atmosphere.
deMenocal, 1995, Science
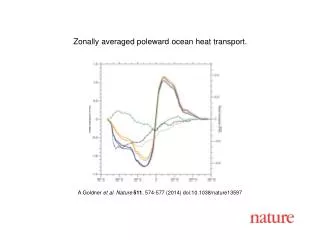
The role of oceanic transport of heat Here’s the heat balance in the modern ocean.
Additional aspects of Milankovitch theory Pattern of phase of paleotemperature records --The 23 kyr precessional effect on insolation is antiphased between the hemispheres. No such pattern is actually observed in the temperature response (ice cores are the best example). The North must somehow transmit the phase to the South!
Layer counting chronology can be transferred to Antarctic ice cores By aligning the gas records (which must be synchronous)
Site 1089 Vostok Epica MD97-2120
O2/N2 indicative of bubble close-off processes From Kawamura et al. 2007
Site 1089 Vostok Epica MD97-2120
EPICA ICE CORE Proxies for temperature (red) and sea ice extent (blue) (%) (‰) (Wolff et al.) Age (kyr B.P.)
The ice core proxy for sea ice cover mirrors the SST proxy in the S.W. Pacificsediment core EPICA (Wolff et al.) MD97-2120 (Pahnke et al.) Age (kyr B.P.)
Additional aspects of Milankovitch theory Pattern of phase of paleotemperature records --The 23 kyr precessional effect on insolation is antiphased between the hemispheres. No such pattern is actually observed in the temperature response (ice cores are the best example). The North must somehow transmit the phase to the South, if you believe Milankovitch! --What about the tropics? What’s the phase of the response, and what season is most critical for forcing? Does the dating of the penultimate deglaciation suggest that the link between insolation and climate lies in the tropical ocean?
from Imbrie et al. Paleoceanography, 1993
The tropical oceans also clearly follow the precessional forcing Bard, G-cubed
S.E. Asian Monsoon Variability in a Chinese speleothem record appears to be a direct response to local insolation (precession) (25°N) Yuan et al. Science, 2004
Chinese speleothem record of S.E. Asian Monsoon variability Wang et al.
The east west asymmetry in response to uniform heating leads to a change in the mean state of sea surface that is forced directly by the the magnitude of the heating (i.e. precessionally related insolation changes). Low Oct. insolation High Oct. insolation
Forcing the dynamics of the equatorial Pacific from Clement et al. 1999 Paleoceanography
This change in the mean state arises from a change in the statistics of El Niño.
Surface air temperature anomaly associated with the last El Niño warm event (1997-1998)
Direct dating of d18O record using U/Th in marine sediments Timing is inconsistent with forcing from summer insolation at 65°N From Henderson and Slowey, 2000, Nature
Most recent compilation of sea level estimates from coral reef terraces All the samples whose U/Th dates satisfy stringent crosschecks on accuracy
Additional aspects of Milankovitch theory Pattern of phase of paleotemperature records --The 23 kyr precessional effect on insolation is antiphased between the hemispheres. No such pattern is actually observed in the temperature response (ice cores are the best example). The North must somehow transmit the phase to the South, if you believe Milankovitch! --What about the tropics? What’s the phase of the response, and what season is most critical for forcing? Does the dating of the penultimate deglaciation suggest that the link between insolation and climate lies in the tropical ocean? Statistics of carbon dioxide variability --Large amplitudes of the 100 kyr and 413 kyr cycle --Proper phase to explain some of the apparent insolation/climate non-linearities?
Suggestion that 100 kyr cycle involves deep ocean temperature, not ice volume
Greenhouse gases clearly participate in the ice age cycles of 100 kyr
Example of variability in deep ocean carbon that operates on 413 kyr timescales
Additional aspects of Milankovitch theory Pattern of ocean heat transport?? --What was the variability in meridional heat transport? Could ocean dynamical effects give rise to feedbacks that amplify the ice age cycles?
Summary Can Ice Age Cycles Be Treated as a Forced Response of a Linear System? (Test of Milankovitch Theory) --If one uses a seemingly plausible time constant of >10 kyr then the coherency of the d18O signal with insolation and the phase of the 23 kyr and 41 kyr response (determined by accepting an age of 125 kyr for the last interglacial period) conform to that expected of a linear system forced by Northern Hemisphere summer insolation. Milankovitch is in good shape! However….one could also model the system by assuming that the “prime mover” involves the effect of orbital geometry on tropical ocean dynamics or the effect of orbital geometry on the carbon cycling (CO2 content of the atmosphere), especially if slightly earlier dates are accepted for the ages of the last interglacial period (128-130 kyr). Milankovitch may need some tweaking!
Connection between the strength of the North Atlantic “conveyor” and the ice ages (from Raymo et al., 1994)
The most famous example of un-forced instability isthe climate record from the Greenland ice core Entire record Evolution of several typical events figure from Ganolpolski et al., 2001, Nature
“Instability” of the North Atlantic surface ocean is clearly associated with cold episodes of the last 500,00 years from McManus et al., 1999, Science
Mechanisms of (unforced) climate instability on millennial timescales • Ice sheet behavior--Large ice sheets may be prone to surging. For example, if the ice insulates the base as the ice cap grows, and the base is heated by a constant geothermal heat flux • Ocean’s overturning circulation--perturbations to the salt balance of the high latitude ocean can disrupt the production of deep water and, therefore, alter the poleward delivery of heat (which then could lead to additional feedbacks) • Tropical ocean/atmosphere interaction--the statistics of ENSO could, in principle change abruptly, which might give rise to climate variability on a global scale.
The “surge” behavior of large ice sheets might produce a flood of icebergs into the high latitude surface waters
Most North Atlantic deep sea sediment cores show evidence of detrital layers rich in sediment that was scraped from Hudson’s bay region. Here’s an example from Gerard Bond’s work.
South Atlantic Record of Antarctic Iceberg Rafting Kanfoush et al., 2000, Science
If one looks closely, is there a pervasive 1500 year cycle of icebergrafting in the North Atlantic Ocean? It’s an open question from Bond et al., 2001, Science
The iceberg flux history of theNorth Atlantic raises the possibility of some kind of “stochastic resonance”, where an omnipresent 1500 year cycle is simply amplified through association with some other (perhaps less regular) instability.
Possible “Binge/Purge” cycle of the Laurentide Ice Sheet MacAyeal, Paleoceanography, 1993
Dansgaard-Oeschger Oscillations and Heinrich Events Climate over the Last Glacial Cycle Taken from: Alley, 1998: Nature,392, 335 - 337
Mechanisms of (unforced) climate instability on millennial timescales • Ice sheet behavior--Large ice sheets may be prone to surging if the ice insulates the base as the ice cap grows, and the base is heated by a constant geothermal heat flux • Ocean’s overturning circulation--perturbations to the salt balance of the high latitude ocean can disrupt the production of deep water and, therefore, alter the poleward delivery of heat (which then could lead to additional feedbacks) • Tropical ocean/atmosphere interaction--the statistics of ENSO could, in principle change abruptly, which might give rise to climate variability on a global scale.
The heat budget of the modern ocean (according to L. Talley)
To what extent is this pattern of temperature associated with the ocean?
Examples of ocean involvement can be found throughout the global oceans: first, in sediment cores from the North Atlantic… from Sachs and Lehman, 1999, Nature
…In cores from the deep Southern Ocean(4700 meters) 0.4 RC11-83/ODP Site 1089 Antarctic Deepwater Chemistry 0 13 12 C/ C of benthic foraminifera -0.4 (in ‰) -0.8 -35 -1.2 18 16 O/ O of ice (in ‰) -40 Summit (Greenland) Air temperatur e -45 0 20 40 60 80 100 120 140 Age (kyr) from Charles et al., 1996, EPSL; Ninnemann et al., 1999, AGU Monograph 112