Download
1 / 14
140 likes | 260 Views
This study investigates the salinity and temperature profiles in the mixed layer of the Lomonosov Ridge, revealing that mean profiles do not adequately represent the mixed layer properties. Significant negative heat fluxes were observed at around 270 m depth, and the upper mixed layer showed a lack of values due to temperature gradient thresholds. The analysis included mean stratification assessments and identified the depth of the mixed layer and pycnocline, highlighting the significance of thermohaline staircases on heat flux measurements.

E N D
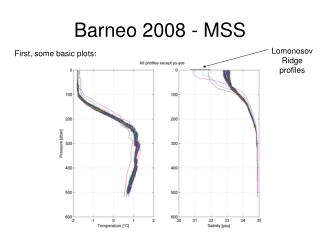
Barneo 2008 - MSS Lomonosov Ridge profiles First, some basic plots:
Mean profiles. Hmm, salinity stratified mixed layer… Seems like the mean profile does not give a good picture of the mixed layer properties, especially regarding salinity
Density and dissipation, upper 100m Update: Discovered that
Heat fluxes: • Modifying Make_HeatFlux_Cox_4m_2008rev.m to be similar to the 2007 version. • Updating the cast list to exclude yo-yo profiles. Also, cast 98 and 213 failed due to bad spectre, so I excluded those as well. Fix later. Mean stratification, 4 m averages, shows that Krho estimates should be ok above ~260 m. Threshold for “low stratification”, 1.7·10-3 s-1 (Fer, 2009), or 1 cycle/hour
Profiles heat flux, all profiles. Cast 4 showed very large negative fluxes around 270m and is not included. • There is a lack of values in the upper mixed layer, check out why… • Seems like a threshold for absolute value of the temp gradient (larger than 1·10-3) excludes a lot of segments in the upper mixed layer. Should be ok down to here Right below temp maxima
Looking at the KT based heat flux: Blue line is mean FHCox, except yoyo and cast 4 and 213. Dashed lines indicate the 95 % confidence interval Need to look closer at the different layers…
Depth of mixed layer and pycnocline Dml is found using the Thomson and Fine routine, Dpyc is found as depth of maximum N2 Mean Dml = 30 m Mean Dpyc = 84 m Sometimes N2 has a secondary maximum in the pycnocline which is slightly larger than the first…
Upper levels of thermocline and halocline, used later to find heat fluxes across the cold halocline layer.
Heat fluxes in mixed layer and upper pycnocline Mean values and 95% confidence intervals: Fh,ml = 0.03 [-0.15 0.21] Wm-2 Fh,pyc = -0.01 [-0.04 0.02] Wm-2 Fhchl = -0.03 [-0.05 -0.01] Wm-2 No significant heat fluxes…
Looking at double diffusive staircases and resulting heat flux Rewriting Ilker’s routine and use a method based on Padman and Dillon (1987), where all the thermohaline staircases are detected from a given treshold and fluxes determined To the right are the average result for all profiles (except yo-yos and Lomonosov) where thermohaline staircases are determined in the range 200 – 450 m and averaged in 10 m bins. Seems like most important depths are 200 - 260 and 290 – 310m. Average fluxes reaching 2 Wm-2 at 225 m.