Download
1 / 12
120 likes | 269 Views
Average Mutual Information and fisheries impacts. Manuel Zetina Rejón. Simulation scenarios. Campeche sound Shrimp Demersal Pelagic Beach seine Octopus Terminos Lagoon Finfish Oyster Blue crab All fisheries. Persistence (P). Magnitude of change (MC). Recovery time (TR). MC.

E N D
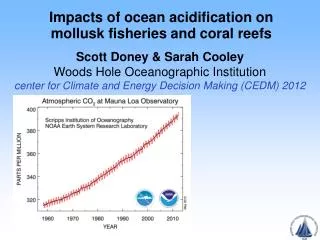
Average Mutual Information and fisheries impacts Manuel Zetina Rejón
Simulation scenarios • Campeche sound • Shrimp • Demersal • Pelagic • Beach seine • Octopus • Terminos Lagoon • Finfish • Oyster • Blue crab • All fisheries
Persistence (P) Magnitude of change (MC) Recovery time (TR) MC Resilience= (R) TR Disturbance Δ F’s Impact evaluation 10% Relative Biomass 0 -10% Time Biomass
10 15 Persistence Magnitude of Change 8 10 6 Octopus 4 5 Finfish Pelagic Octopus Shrimp 2 Beach seine Beach seine All All Axis 2 (20 %) Axis 2 (9 %) 0 0 Shrimp Pelagic -2 Finfish Demersal -5 -4 -6 -10 -8 Demersal -10 -15 -10 -8 -6 -4 -2 0 2 4 6 8 10 -15 -10 -5 0 5 10 15 Axis 1 (49 %) Axis 1 (72 %) 15 10 Recovery time Resilience 8 10 6 Shrimp 4 5 All Octopus 2 Beach seine Shrimp Beach seine Pelagic All Axis 2 (10 %) Axi 2 (16 %) 0 0 Pelagic Octopus Finfish Demersal -2 -5 -4 Demersal -6 -10 Finfish -8 -15 -10 -15 -10 -5 0 5 10 15 -10 -8 -6 -4 -2 0 2 4 6 8 10 Axis 1 (70 %) Axis 1 (57 %) Effects of fisheries
Resilience indicator:Area of change (AC) Low Impacts = Low AC High Impacts = High AC
2.0 Shrimp SC Demersal SC Pelagic SC 1.8 1.6 1.4 1.2 1.0 0.8 0.6 0.4 0.2 2.0 Beach seine SC Octopus SC Finfish LT 1.8 1.6 1.4 1.2 Relative Biomass 1.0 0.8 0.6 0.4 0.2 2.0 Oyster LT Blue crab LT All 1.8 1.6 1.4 1.2 1.0 0.8 0.6 0.4 0.2 2 6 10 14 18 22 26 30 34 38 42 46 50 2 6 10 14 18 22 26 30 34 38 42 46 50 2 6 10 14 18 22 26 30 34 38 42 46 50 Years of Simulation Area of Change AC=43.3 AC=102.8 AC=201.3 AC=22.8 AC=37.0 AC=77.9 AC=0 AC=0 AC=258.4
36 31 All Pelagic 26 21 Shrimp RECOVERY TIME 16 2 R = 0.97 Demersal 11 Finfish Octopus 6 2 R = 0.96 Beach seine 1 161 141 All Pelagic 121 101 81 Finfish MAGNITUDE OF CHANGE 61 Shrimp Octopus 41 Demersal 21 Beach seine 1 50 100 150 200 250 300 AC
Information Theory (Ulanowicz, 1986) • Average Mutual Information ( I ) measures the probability that a unit of energy flows to certain destination. • When uncertainty of the destination is high, I is bigger, quantifies degree of articulation in network/models. • Measure of organization, higher in mature and complex systems. • The I is higher while more complex trophic links. I = Lower I = Higher
Hypothesis When a fishery catch or remove biomass of group of species with simple trophic links, the impact of this fishery could be more severe, making ecosystem's stability and resilience vulnerable when high biomasses are extracted from the system
3.0 2.5 All Pelagic 2 R = 0.6 2.0 Finfish Shrimp Demersal log AC 1.5 Octopus Beach seine Blue crab Oyster 1.0 0.5 - - 1.0 2.0 3.0 4.0 5.0 6.0 7.0 I F AC vs.IF
1.6 1.4 1.2 1.0 0.8 0.6 0.4 Model Validation 0.2 3.0 2.5 2.0 1.5 1.0 0.5 1984 1988 1992 1996 Research strategy Realistic Model Simulation scenarios (changes in fishing intensity) Evaluation of Impacts Time series Observed data