Download
1 / 41
410 likes | 424 Views
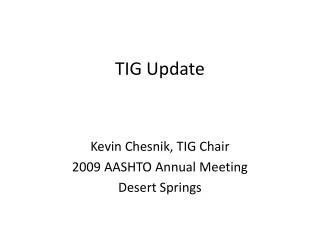
Wisconsin Transition Improvement Grant (TIG) Transition Improvement Plan (TIP). Tools to Improve the Postsecondary education and employment outcomes of Youth with Disabilities June 2017. Transition Improvement Grant (TIG). The TIG project has developed these web-based tools

E N D
Wisconsin Transition Improvement Grant (TIG) Transition Improvement Plan (TIP) Tools to Improve the Postsecondary education and employment outcomes of Youth with Disabilities June 2017
Transition Improvement Grant (TIG) • The TIG project has developed these web-based tools • Transition Improvement Plan (TIP) • Graduation Rate Improvement Plan (GRIP) • Uses Wisconsin and National resources to assist individual educators and school teams in becoming more familiar with the evidence-based practices (EBPs) which increase the post school outcomes and graduation rates of youth with disabilities
Why Engage in the TIP and / or GRIP? • Educators often find it difficult to find the resources or the time to read journal articles, assimilate the information, and then create lesson plans and practices to implement in their schools and classrooms. • Individual educators and school teams need a consistent, easily-accessible format that will allow them to review a large amount of information in an efficient manner, create a plan that can be implemented, and follow the results of their efforts using statewide and local Indicator data.
Use these tools to . . . • Improve postsecondary transition plan (PTP) planning. • Identify areas of strength and need within your transition strategies and activities. • Develop an individual educator or school team customized transition plan to increase student outcomes. • Conduct predictor self-assessment annually to show progress over time. • Connect to other district/state initiatives and staff Transition Improvement Grant (www.witig.org) IDEA CFDA #84.027 October 2016
TIP Website and linked GRIP Website
The TIP and GRIP are not intended to be so difficult to use that they cannot be used without a TIG Coordinator facilitating the process, but it allows the entire school team to participate, and may come with a stipend.
Wisconsin Transition Improvement Grant (TIG) Tools to Improve the Post School Outcomes of Youth with Disabilities 10
Indicator 14 Outcomes Required once within a 5-year cycle Review Indicator 14 Outcomes Reviewing district and state Indicator 14 Outcomes is an important first step in understanding the outcomes targeted for improvement.
Wisconsin Post School Outcomes (PSO) Survey of Youth with Disabilities 13
Indicator 14 • Unduplicated count of participation in activities of post school engagement. • Required once within a five-year cycle. • Minimum 20% district response rate. • 3 data points reported to DPI. • DPI combines with other cohort-year districts and reports those 3 data points to OSEP annually. • Improvement efforts and targets are a stateresponsibility under the current DPI Self-Assessment Monitoring Cycle
Who is Contacted? • All district former students who exited school with • a regular diploma • certificate of attendance • maximum age of eligibility for services (age 21) • dropped out • Only those with active IEPs at the time of exit – no former or 504 • Not those who returned to school • Based on district ISES Exiter Report – district decides who is an exiter and in what category, and DPI shares this database with PSO website.
FFY2017 2017-18 Exiters
FFY2017 2017-18 Exiters
FFY2017 2017-18 Exiters
2016 PSO Survey of 2014-15 exiters • 194 (50%) of 388 districts participated in the 2016 PSO survey • 37 (10%) additional districts elected to participate in a non-required year • Of those 194 districts: • 157 (81%) were required to participate (2016 combined two required year groups which resulted in a 40% required sample) • 37 (19%) chose to participate in a non-required year • 2378 of 4257 (56% response rate) successful interviews • With a total budget of $100,00, the 2016 Special Education Transition Incentive Grant will fund eligible 2014-15 exiters @ $57.57 • 180 districts (1737 eligible exiters) applied for funds • 14 districts did not apply for funds or had exiters not eligible for funds (72 exiters) • June 2017 payments will range from $57.57 (1 eligible) to $2,130.09 (37 eligible)
2017 PSO Survey of 2015-16 exiters • 179 (46%) of 388 districts willparticipate in the 2017 PSO survey • 92 (30%) additional districts have elected to participate in a non-required year • Of those 179 districts: • 87 (22%) are required to participate • 92 (24%) chose to participate in a non-required year • The Special Education Transition Incentive Grant line-item is in the Governor’s 2017-18 and 2018-19 biennial budget • The amount is undetermined at this time however the amount in the budget represents a significant increase from the previous biennial budget
TIP: Review Indicator 14 PSO data Indicator 14 helps us describe further education and competitive employment experiences of youth with disabilities as they transition from high school to adult life
Locating Missing or Additional Indicator 14 Data • Some District Indicator 14 Reports will not have outcomes data: • * = indicates fewer than 5 exiters in the population- = indicates no exiters this survey year • If your district data is not shown or you want additional data: • Log into the secure portion of the WiPSO website (www.wipso.org). • Contact your district Director of Special Education/Pupil Service or Transition Coordinator to get a password. • View your district’s Indicator 14 data and complete the questions on the “Indicator 14 Review”.
Indicator 14 Report • Review and discuss with your team: • Response Rates • Differences in outcomes between district and state - higher or lower than state? • Representativeness • Areas of needed improvement planning • To print, at top of page, click
TIP: Predictor Ratings and Improvement Planning • National In-School Predictors of Post School Success • Evidence-based transition practices which are likely to lead to positive post school outcomes for students with disabilities. • Extracted from high quality correlational research • Operational definitions and essential program characteristics from experts in the field. Predictor Ratings and Transition Improvement Planning (TIP) • http://www.transitionta.org/ 25
TIP: Predictor Ratings and Improvement Planning • TIP is a self-assessment • Individual educators and school teams • Framework for determining the degree to which EBPs (practices that are likely to lead to more positive post school outcomes for students with disabilities) are currently being implemented • Understanding that youth and families cannot benefit from programs and activities in which they are not exposed • Develop a plan of improvement for Predictors rated as “High Priority” 27
TIP Predictors • All Predictors are related to students with disabilities. • You or your school are engaged in many of these transition activities already. • As a classroom teacher, know you are not responsible for implementing ALL of these activities. • Read through the Predictors • Gain an awareness of those activities in which research shows more positive outcomes for youth with disabilities when high school students are engaged in these activities.
Rubric Ratings • All Predictor ratings are related to students with disabilities. • Read through the ratings and get a “feel” for the ratings. • Ok to have lots of 0s, 1s, and 2s. • 5s limited to “using data about this predictor to make decisions”.
Select Predictor Ratings and Activities Read through each of the Predictors and assign a rating. Select those you want to “Add to Your Plan”. Click the “+” and see the Activities related to this Predictor. Click the Activities that you want to plan for. These are your priorities for planning. You can uncheck any item you want, or leave on your plan with no activities so they are “next on deck”.
Select Predictor Ratings and Activities • Check the Predictors you want to “Add to your Plan”. • Click the “+” for those you checked. • Read through the activities and decide if you want to add them to your plan. Predictor “Score”, based on a 0 to 5 scale
Predictor Activities • Check the activities you want to add to your plan - specific, personalized activities, • State what, who and when the activities will be completed. • Every Predictor has “Other” added to plan discussion time.
Selecting Activities The “Predictor Activities” are meant to get you started creating a plan of improvement that is specific to your classroom or team goals. They are additional Predictors, DPI practices or TIG activities. These are all evidence-based practices or high quality activities. Read through and select desired suggested “Activities”. Each Predictor has an “Other” Activity. Select this to add your own unique activities or time to discuss.
Saving Work and Printing Indicator 14 Review • Be sure to record parts of the team discussion or thoughts about your data. Add “Comments” as you work. • Click “Save in Progress” to return to “My Toolbox”. • Every keystroke is saved so you can move between the tabs as desired. • To print, at top of page, click
Save your work and return later Click this link most often when working between tools or returning to your plan. Click this when you want to lock and archive your plan and begin building your “Ratings Over Time” chart. You will receive an email that the TIP has been archived and that you will no longer be able to make changes to the Rubric Ratings or Activities Plan.
At-A-Glance View of Ratings and Selected Activities • Each time you “Finalize and Submit” your report and complete a new Rubric Rating, this table will fill in to the right with new columns of data. • Great artifact for your PDP or SLOs.
Next Steps Planning • This form auto-fills as selected activities are checked. • See Comments • Review and add or delete activities before you start your plan. • Complete additional questions.
At-A-Glance • One-page view of where your team rated all of the Predictors. • Print this and keep where you can view it. • Use as an artifact for your PDP or SLOs
Print Your Plan Reports and Plan auto-fill as you work Ratings Over Time Predictors Scores fill as “Save and Submit” is selected Predictor Printable All Predictors and Activities Checked if selected Predictor Activities Just the Predictors and Activities added to your plan At-a-Glance All 34 Predictors in columns by score
Rubric Ratings Over Time • This report auto-fill report shows your plan ratings over time. • When you or your team completes a second Rubric rating, columns fill to the right.