Download
1 / 11
850 likes | 2.5k Views
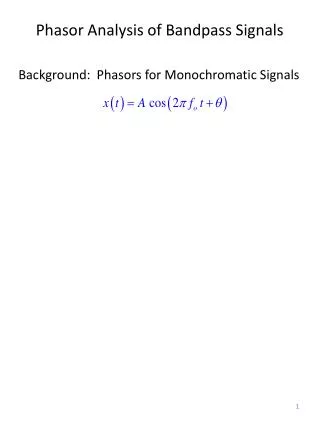
Phasor Diagrams and Phasor Algebra. Md Shahabul Alam Dept. of EEE. Phasor Diagrams and Phasor Algebra. The Phasor Diagram Phasor Diagram of a Sinusoidal Waveform Phase Difference of a Sinusoidal Waveform Phasor Addition Phasor Subtraction The 3-Phase Phasor Diagram

E N D
Phasor Diagrams and Phasor Algebra MdShahabulAlam Dept. of EEE
Phasor Diagrams and Phasor Algebra • The Phasor Diagram • Phasor Diagram of a Sinusoidal Waveform • Phase Difference of a Sinusoidal Waveform • PhasorAddition • Phasor Subtraction • The 3-Phase Phasor Diagram • Phasor Diagram Summary
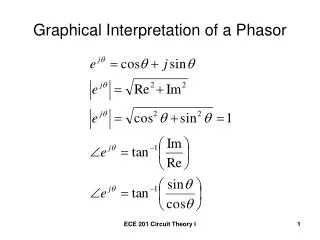
The PhasorDiagram • Basically a rotating vector, simply called a “Phasor” is a scaled line whose length represents an AC quantity that has both magnitude (“peak amplitude”) and direction (“phase”). • anti-clockwise rotation of the vector is considered to be a positive rotation. Likewise, a clockwise rotation is considered to be a negative rotation.
Phasor Diagram of a Sinusoidal Waveform The current, i is lagging the voltage, v by angle Φ and in our example above this is 30o. So the difference between the two phasors representing the two sinusoidal quantities is angle Φ and the resulting phasor diagram will be.
Phasor Diagram of a Sinusoidal Waveform • The phasor diagram is drawn corresponding to time zero ( t = 0 ) on the horizontal axis • The lengths of the phasors are proportional to the values of the voltage, ( V ) and the current, ( I ) at the instant in time • The current phasor lags the voltage phasor by the angle, Φ, as the two phasors rotate in an anticlockwisedirection. • the voltage phasor is “leading” the current phasor by angle, Φ. • one phasor is designated as the referencephasor and all the other phasors will be either leading or lagging with respect to this reference.
PhasorAddition and Subtraction • Consider two AC voltages, V1 having a peak voltage of 20 volts, and V2 having a peak voltage of 30 volts where V1 leads V2 by 60o. The total voltage, VT of the two voltages can be found by firstly drawing a phasor diagram representing the two vectors and then constructing a parallelogram in which two of the sides are the voltages, V1 and V2 as shown below
Voltage, V2 of 30 volts points in the reference direction along the horizontal zero axis, then it has a horizontal component but no vertical component as follows. • Horizontal Component = 30 cos 0o = 30 volts • Vertical Component = 30 sin 0o = 0 volts This then gives us the rectangular expression for voltage V2 of: 30 + j0 Voltage, V1 of 20 volts leads voltage, V2 by 60o, then it has both horizontal and vertical components as follows. • Horizontal Component = 20 cos 60o = 20 x 0.5 = 10 volts • Vertical Component = 20 sin 60o = 20 x 0.866 = 17.32 volts This then gives us the rectangular expression for voltage V1 of: 10 + j17.32 The resultant voltage, VT is found by adding together the horizontal and vertical components as follows. VHorizontal = sum of real parts of V1 and V2 = 30 + 10 = 40 volts VVertical = sum of imaginary parts of V1 and V2 = 0 + 17.32 = 17.32 volts
The 3-Phase PhasorDiagram • A balanced three-phase voltage supply consists of three individual sinusoidal voltages that are all equal in magnitude and frequency but are out-of-phase with each other by exactly 120o electrical degrees.
Phasor Diagram Summary • Vectors, Phasors and Phasor Diagrams ONLY apply to sinusoidal AC waveforms. • A Phasor Diagram can be used to represent two or more stationary sinusoidal quantities at any instant in time. • Generally the reference phasor is drawn along the horizontal axis and at that instant in time the other phasors are drawn. All phasors are drawn referenced to the horizontal zero axis. • Phasor diagrams can be drawn to represent more than two sinusoids. They can be either voltage, current or some other alternating quantity but the frequency of all of them must be the same. • All phasors are drawn rotating in an anticlockwise direction. All the phasors ahead of the reference phasor are said to be “leading” while all the phasors behind the reference phasor are said to be “lagging”. • Generally, the length of a phasor represents the R.M.S. value of the sinusoidal quantity rather than its maximum value. • Sinusoids of different frequencies cannot be represented on the same phasor diagram due to the different speed of the vectors. At any instant in time the phase angle between them will be different. • Two or more vectors can be added or subtracted together and become a single vector, called a Resultant Vector. • The horizontal side of a vector is equal to the real or x vector. The vertical side of a vector is equal to the imaginary or y vector. The hypotenuse of the resultant right angled triangle is equivalent to the r vector. • In a three-phase balanced system each individual phasor is displaced by 120o.