Comparison of Old and New Monte Carlo Sets in STARlight Analysis
This document presents a comprehensive comparison between the old and new Monte Carlo (MC) sets generated for STARlight. Both sets consist of 400k events, with adjustments made for the matching exponential slope of the t-spectrum. The old MC set utilized a radius matched to the exponential slope for both interference and no-interference scenarios, while the new MC set maintained a consistent radius across the datasets. Key statistical parameters and fit functions (Ae^-k*t) were analyzed to evaluate detector effects and efficiency for different topologies. Results include ratios of GEANT-corrected and uncorrected t-spectra.

Comparison of Old and New Monte Carlo Sets in STARlight Analysis
E N D
Presentation Transcript
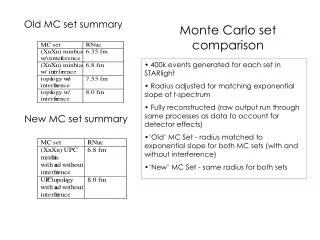
Old MC set summary Monte Carlo set comparison New MC set summary • 400k events generated for each set in STARlight • Radius adjusted for matching exponential slope of t-spectrum • Fully reconstructed (raw output run through same processes as data to account for detector effects) • ‘Old’ MC Set - radius matched to exponential slope for both MC sets (with and without interference) • ‘New’ MC Set - same radius for both sets
400k events generated for MinBias (XnXn) MC set in STARlight • Radius adjusted for matching exponential slope of t-spectrum • fit function = Ae-k*t • data k = 302 GeV-1 • MC k = 296 GeV -1 • fit range: 0.004 < t < 0.01
400k events generated for topology (0n0n) MC set in STARlight • Radius adjusted for matching exponential slope of t-spectrum • fit function = Ae-k*t • data k = 373 GeV-1 • MC k = 371 GeV -1 • fit range: 0.004 < t < 0.01
1 2 Explanation of plots: Ratio of GEANT corrected Monte Carlo (STARlight) interference t-spectrum (t~pT2) to no-interference t-spectrum Ratio of uncorrected STARlight interference t-spectrum to no-interference t-spectrum Efficiency curves calculated for interference and no-interference scenarios (ratio of MC t-spectrum run through GEANT to t-spectrum not run through GEANT) MC interference histogram (blue), MC no-interference histogram (green), uncorrected data (red points), overall parameterization (red curve) uncorrected data (red points), overall parameterization (red curve) 3 4 5
1 2 Explanation of statistics: (1) p0 - p6, fit parameters for 6th order polynomial fit to ratio (2) Same as 1 (4 &5) p0 - p2 come from overall fit: p0 = A p1 = c p2 = k UPC MinBias(with nuclear excitation) or UPC topology(without nuclear excitation) = trigger dataset 3 4 5
old UPC MinBias 0.1 < y < 0.5 new UPC MinBias 0.0 < y < 0.5
old UPC MinBias 0.1 < y < 0.5 new UPC MinBias 0.0 < y < 0.5
old UPC MinBias 0.5 < y < 1.0 new UPC MinBias 0.5 < y < 1.0
old UPC MinBias 0.5 < y < 1.0 new UPC MinBias 0.5 < y < 1.0
old UPC Topology 0.1 < y < 0.5 new UPC Topology 0.1 < y < 0.5
old UPC Topology 0.1 < y < 0.5 new UPC Topology 0.1 < y < 0.5
old UPC Topology 0.5 < y < 1.0 new UPC Topology 0.5 < y < 1.0
old UPC Topology 0.5 < y < 1.0 new UPC Topology 0.5 < y < 1.0