Download
1 / 1
10 likes | 165 Views
Spatio-chromatic image content descriptors and their analysis using Extreme Value theory Vasileios Zografos and Reiner Lenz (zografos@isy.liu.se , Reiner.Lenz@liu.se ) Computer Vision Laboratory, Linköping University, Sweden. Garnics. 2. Spatio-chromatic descriptors. 1. Introduction.

E N D
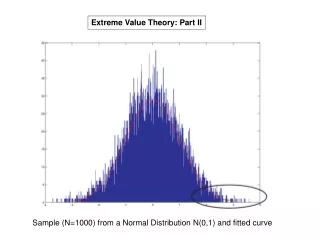
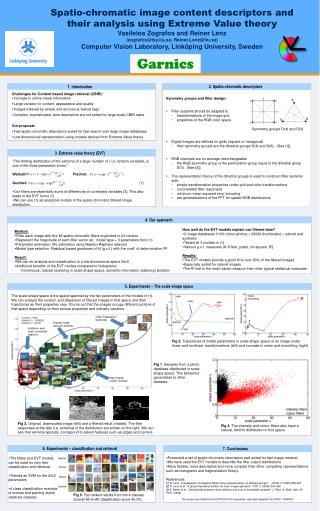
Spatio-chromatic image content descriptors and their analysis using Extreme Value theory Vasileios Zografos and Reiner Lenz (zografos@isy.liu.se, Reiner.Lenz@liu.se) Computer Vision Laboratory, Linköping University, Sweden Garnics 2. Spatio-chromatic descriptors 1. Introduction • Challenges for Content based image retrieval (CBIR): • Increase in online visual information • Large variation in content, appearance and quality • Images indexed by simple and erroneous textual tags • Complex, sophisticated, slow descriptors are not suited for large scale CBIR tasks • Our proposal: • Fast spatio-chromatic descriptors suited for fast search over large image databases • Low dimensional representation using models derived from Extreme Value theory • Symmetry groups and filter design: • Filter systems should be adapted to • transformations of the image grid • properties of the RGB color space • Digital Images are defined on grids (square or hexagonal) • their symmetry groups are the dihedral groups D(4) and D(6). (See [1]). • RGB channels are on average interchangeable • the RGB symmetry group is the permutation group equal to the dihedral group D(3). (See [2]). • The representation theory of the dihedral groups is used to construct filter systems with: • simple transformation properties under grid and color transformations • uncorrelated filter responses • minimum-mean-squared error encoding • are generalizations of the FFT for spatial RGB distributions Symmetry groups D(4) and D(3) 3. Extreme value theory (EVT) • “The limiting distribution of the extrema of a large number of i.i.d. random variables, is one of the three parametric forms:” • Weibull: , Frechet: • Gumbel: (1) • Our filters are essentially sums of differences of correlated variables [3]. This also leads to the EVT forms (1) • We can use (1) as analytical models of the spatio-chromatic filtered image distribution. 4. Our approach • Method: • Filter each image with the 48 spatio-chromatic filters organized in 24 vectors • Represent the magnitude of each filter vector as: model type + 3 parameters from (1) • Parameter estimation: ML estimation using Newton-Raphson descent • Model type selection: Residual based goodness-of-fit (g.o.f.) with the coeff. of determination R2 • Result: • We can do analysis and classification in a low dimensional space 24x3 • Additional benefits of the EVT models compared to histograms: • Continuous; natural clustering in scale-shape space; semantic information (saliency) isolation • How well do the EVT models explain our filtered data? • 2 image databases (1100 colour photos + 30000 thumbnails) – natural and synthetic • Tested all 3 models in (1) • Various g.o.f. measures (K-S test, g-test, chi-square, R2) • Results: • The EVT models provide a good fit to over 80% of the filtered images • Especially suited for natural images • The R2test is the most robust measure than other typical statistical measures 5. Experiments – The scale-shape space The scale-shape space is the space spanned by the two parameters of the models in (1). We can analyse the location and dispersion of filtered images in that space and their trajectories as their properties vary. It turns out that the images occupy different portions of that space depending on their texture properties and intensity variation. Fig 2. Trajectories of model parameters in scale-shape space of an image under linear and nonlinear transformations (left) and increase in noise and smoothing (right) Fig 1. Samples from a photo database distributed in scale-shape space. This behaviour generalises to other datasets. Fig 3. Original, downscaled image (left) and a filtered result (middle). The filter responses at the tails (i.e. extrema) of the distribution are shown on the right. We can see that extrema typically correspond to salient features such as edges and corners. Fig 4. The intensity and colour filters also have a natural, distinct distribution in this space. 6. Experiments – classification and retrieval 7. Conclusions • Presented a set of spatio-chromatic descriptors well suited for fast image retrieval • We have used the EVT models to describe the filter output distributions • More flexible, more descriptive and more compact than other competing representations such as histograms and fragmentation theory. • References: • [1] R. Lenz. “Investigation of receptive fields using representations of dihedral groups” JVCIR 6 (1995) 209-227 • [2] R. Lenz et al. “A group theoretical toolbox for color image operators” ICIP 3. (2005) 557-560 • [3] E. Bertin et al. “Generalized extreme value statistics and sum of correlated variables” J. Phys. A: Math. Gen. 39 7607, (2006) • This research was funded by the EU FP7/2007-2013 programme, under grant agreement No 247947 – GARNICS. • The filters and EVT models can be used for very fast classification and retrieval. • Trained an SVM on the 24x3 parameters • 4 class classification example of scenes and painting styles (abstract classes) Fig 5. Top ranked results from the 4 classes. Overall All-to-All classification score 40.5%.