Download
1 / 36
360 likes | 496 Views
Feedback from terrestrial productivity changes to the climate Model predictions of greenhouse gas emission at a regional scale Klaus Butterbach-Bahl Institute for Meteorology and Climate Research Atmospheric Environmental Research (IMK-IFU) Forschungszentrum Karlsruhe

E N D
Feedback from terrestrial productivity changes to the climate • Model predictions of greenhouse gas emission at a regional scale • Klaus Butterbach-Bahl • Institute for Meteorology and Climate Research • Atmospheric Environmental Research (IMK-IFU) • Forschungszentrum Karlsruhe • Garmisch-Partenkirchen, Germany
Change Nitrification Soil C and N turnover Denitrification Manag. Soil microbial community Temp. Physico-chemical environment (radiat., soil T& - moist., compact., O2, C/N avail.) Plant litter (QA/QN) & Exudation Biospere-Atmosphere Exchange of CH4 & N2O Precip. Plant species composition CO2 CH4-Prod. Plant Physiology (WUE, Photosynthesis) N-Dep. (O3, …) CH4-Oxid. Global Changes and soil N2O and CH4 exchange Land use Climate change Atmosph. Compos.
+soil microbial activity +soil N- cycling -O2 avail. +DOC avail. Increased N2O Understanding the environmental feedbacks between C and N cycling VOC Increased SOC NOx CO2 90% N2O 60-70% Photosynthesis CH4 Isoprenoid- production 60-70% Nitrification Denitrification CH4-Oxidation Methanogenesis
The challenge: Regional fluxes • Bridgingthegap: processunderstanding ↔ ecosystem/ regional fluxes • Empirical/ statisticalapproachesforinventories • IPCC andemissionfactors • Robust (mostlikely), but canhardlybeusedfor • evaluatinglanduse/ landmanagementstrategies, or • assessingclimate-biospherefeedbacks • Processorientedmodeling • DayCent, DNDC, CERES, COUP, etc. • Complex processesdescriptions, highparameterdemand • still needfurtherdevelopmentand UC assessment, but • providerealisticsimulationofecosystemprocesses • allowtotesthypotheses, • canbeusedtoassess global changefeedbacks 4 | V. Name | Organisationseinheit | TT.MM.JJJJ
GIS coupling for GIS – the problem of data GIS database for DNDC Data source Data content format ISRIC- WISE ESDB v1 Clay content pH bulk density Polygon 10km x 10km Grid Spatial information SOIL Map of Topsoil OrganicCarbon SOC 1x1 km2 Grid GIS DATABASE MM5 Temperature Precipitation PAR Latitude 10x10 km2 Grid CLIMATE EMEP N deposition 50x50 km2 Grid DNDC CAPRI Crop type/area 1x1 km2 Grid EUStat Fertilizer input Yield (kg/ha) NUTS Regions MANAGEMENT Emission Inventory of European agricultural soils Sowing and Harvest date (2003) LUCAS Points
Motivation Strategy Sites&Methods Results Australia Global Outlook Model testing Simulated N2O-emissions [g N ha-1] Measured N2O-emissions [g N ha-1]
Global N2O inventory Werner et al., 2007, JGR – Global Biogeochem. Cycl.
Interannual variability Werner et al., 2007, JGR – Global Biogeochem. Cycl.
Comparison with earlier estimates • What is the area we are talking about?(all N2O emissions scaled to the area used in this study; orange: scaled / white: original) • Matson and Vitousek 1990: 1.8 Tg N yr-1 (2.4 Tg N yr-1) • Bouwman et al. 1995: 1.5 Tg N yr-1 (2.3 Tg N yr-1) • Potter 1998: 1.3 Tg N yr-1 • Breuer et al. 2000: 2.6 Tg N yr-1 (3.55 Tg N yr-1) • Stehfest and Bouwman 2006: 1.5 Tg N yr-1 (1.17 Tg N yr-1) • This study: 1.3 Tg N yr-1 (± 0.3 SD) Werner et al., 2007, JGR – Global Biogeochem. Cycl.
Predictions for Europe GIS database for DNDC Data source Data content format ISRIC- WISE ESDB v1 Clay content pH bulk density Polygon 10km x 10km Grid Spatial information SOIL Map of Topsoil OrganicCarbon SOC 1x1 km2 Grid GIS DATABASE MM5 Temperature Precipitation PAR Latitude 10x10 km2 Grid CLIMATE EMEP N deposition 50x50 km2 Grid DNDC CAPRI Crop type/area 1x1 km2 Grid EUStat Fertilizer input Yield (kg/ha) NUTS Regions MANAGEMENT Emission Inventory of European agricultural soils Sowing and Harvest date (2003) LUCAS Points
Identifying key regions Crop yield - statistics Simulated N2O Simulated NO3 leaching Crop yield - DAYCENT Del Grosso et al., 2006, J. Env. Qual.
Inventorying soil N trace gas fluxes and identifying feedbacks Simulated forest area of Europe: 1 410 477km2
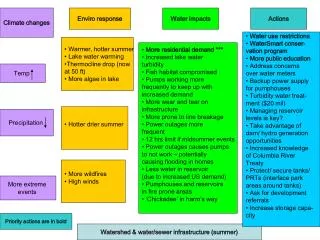
Climate change feedbacks ( 2031-2039) - (1991-2000) [A2 scenario] ECHAM4 MCCM/MM5 regionalisation (60kmx60km)
Climate change feedbacks ( 2031-2039) - (1991-2000) Seasonal changes in soil moisture Kesik et al., 2006, JGR - Biogeosciences 23 | V. Name | Organisationseinheit | TT.MM.JJJJ
Climate feedbacks on forest soil N2O/NO emissions NO N2O Temp. Precip. Kesik et al., 2006, JGR - Biogeosciences
Climate feedbacks on forest soil N2O/NO emissions Kesik et al., 2006, JGR - Biogeosciences 25 | V. Name | Organisationseinheit | TT.MM.JJJJ
Climate feedbacks on N2O/N2 ratio. Is this realistic? Kesik et al., 2006, JGR - Biogeosciences
+ + + + ? − + + ? + − + ? ? ? ? ? − C/N ratio + Primary production + + − ? + Carbon Cycle Land use change Fossil fuel burning Industrial N2 fixation Human drivers Atmospheric CO2 Atmospheric reactive N Atmospheric drivers Climate warming N2 fixation Biogeochemical Cycles Biologically Available N Denitrification N-Cycle Gruber & Galloway, Nature 2008
Summary • Nr emission/ deposition processes are by far more complex as compared to e.g. CO2-exchange processes, due to • Complexity of involved processes • Complexity of feedbacks to environmental drivers • Nr cascading on landscape/regional and global scales • Understanding of microbial production and consumption processes under changing environmental conditions is still incomplete, and • Link between process understanding, field observations and model implementation cannot always be established • Closing the N cycling remains difficult due to uncertain N2 losses • Long-term measurements are needed [holistic approach] • Models need to address the regional scale and linking of biogeochemical models to hydrological models is needed
Atmosphere PLANT PROCESSES • Phenology • Ressource capture • Partitioning • Senescence CO2, N2O, NH3, NO SOIL TRANSFERS • Heat (Fourier) • Water (Tipping bucket) • Nitrate (Convective) mineral N organic N C-N BIOTRANSFORMATIONS Mineralisation - Immobilisation Nitrification - Denitrification Soil Groundwater Process oriented modeling of ecosystem N- (C-) fluxes Atmospheric N input Human management Biomassremoval Crop type/ fertilization crop residues absorption Tillage/ drainage drainage, nitrate leaching
aerobic soil matrix anaerobic soil matrix Conceptual model of an anaerobic balloon CH4-consumption CO2 CH4 DOC CH4 CO2 CH4-production denitrification NO3-→ NO2-→ NO → N2O → N2 N2O NO NO3- NO2- NH4+ nitrification
Model evaluation: SOC dynamics Illinois, USA Rothamsted, UK wheat/fallow Winter wheat barley/potato/wheat/sugarbeet Bad Lauchstädt, Germany Waite, Australia Li, Frolking, Butterbach-Bahl, Climatic Change, 2005
Model evaluation: N2O fluxes Li, Frolking, Butterbach-Bahl, Climatic Change, 2005
Model evaluation: NO fluxes [forests] Kesik et al., 2006, Biogeosciences
Eh changes driven in CH4/N2O fluxes in rice paddies Li et al., 2005,Glob.Biogeochem. Cycl.
Model evaluation: Soil water fluxes Altdorf Flossenbürg