Download
1 / 33
340 likes | 484 Views
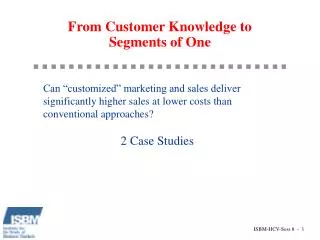
From Customer Knowledge to Segments of One. Can “customized” marketing and sales deliver significantly higher sales at lower costs than conventional approaches? 2 Case Studies. ISBM-HCV-Sess 8 - 1. Overview.

E N D
From Customer Knowledge toSegments of One Can “customized” marketing and sales deliver significantly higher sales at lower costs than conventional approaches? 2 Case Studies ISBM-HCV-Sess 8 - 1
Overview • Question: Can “customized” marketing and sales deliver significantly higher sales at lower costs than conventional approaches? • Evidence: Two Fortune 500 B to B test cases • Industrial equipment distributor • Telecom service provider
Background There are two tactical marketing approaches competing for future corporate investments KEY FEATURES • Feature • Elements • Conventional Database • Marketing • Customized • Marketing • Information Platform: • Customer behaviors • Secondary data (i.e., D&B, proprietary, subscription) • Customer behaviors • Secondary data • Survey data • Markets: • Medium and small businesses • All businesses • Target Focus: • Homogeneous groups/ segments • Groups/individual customers • Communications Move: • One way • Interactive • Channels: • All • All • Offer Configuration: • Product focused • One message to all or separate message/group • Solution focused • Customized message for each customer
Step #1 Market manager defines Increase caller ID revenues objectives Example Background How does conventional database marketing work? • Step #2 Database marketing appliespattern seeking models to selectand prioritize prospects • Step #3 Marketing defines offer and • General product feature benefits • message, then selects channel(s) • Price/benefit • • Mail/telemarketing • • Direct response brochure • Step #4 Channel(s) implementation • Scripted telemarketing • Step #5 Campaign results • Response feedback to models
Example Background How does customized marketing work? • Step #1 Market manager uses desktop • access to identify and select • opportunity • Step #2 Selection results in prioritized • prospect list and channel • query tools • Step #3 Market manager downloads list • and query tools to channels • Step #4 Channel(s) implementation • Step #5 Campaign results fed back to Real time model adjustments to improve • models real time and prospect accuracy • query models updated
“Best Offer” Query Model: Female-owned small business Line of Business? Other ________ Professional/Social/Personal Services Alternative Model N Y N Work at Home? Y Customer Access Problem? Offer A Customer Access Problem? Y N Caller ID? Y Y Offer A Call/Caller Priorities? N N Terminate Offer B Which Complaints? Offer D N Y Have Website? • Can’t Find You • Busy Signal • Frustrating Voice-Mail • Put on Hold Too Long • Other Compete with personalized service? Offer C N Y Terminate Offer D Customized Recommendation Integration of Targeting and Relationship Management
Case Study #1: Company Background Case Study #1: Company Background Type of Business: Distributor of industrial equipment Size: $4 billion/year, 1.5 million customers Geographic Scope: U.S. Channels Used: Direct sales Direct mail Call centers Internet Walk-in branches Customer Base: Large to small businesses Database Resources: • Data warehouse • Customer records include SIC, number of employees, number of locations, sales revenues, purchase history Primary Targeting Method (prior to 1997) • Customers: recency, frequency and volume • Prospects: underpenetration models using SIC and size
Marketing Problem Small business customer revenue growth flat after several years of double digit growth Research and competitive intelligence suggest spending in small business market growing Response rates and revenue yields on most legacy marketing initiatives flat Suspect: database marketing model performance peaked
Remedial Action Conduct research to identify customer needs Product category Procurement/planning Service Delivery Segment customers on needs patterns Assign all customers to segments Integrate into customer and prospect data records Proposed application: Add needs to targeting algorithms Use targeted needs in MARCOM collateral Test impact of needs integration versus existing targeting models
Jack Hammer Construction 321 Main Street Milwaukee, WI 10872 613-772-0172 Bill Jones: Supply Manager SIC: Construction Size: 20+ employees Recency: 5 (moderate) Frequency: 2 (light) Volume: 8 (high) Needs: B2 (Efficiency) S4 (Product Choice) S8 (Delivery Choice) Bu6 (Easy Return) B&G Construction 1001 Center Street San Ramon, CA 40782 415-693-7720 Humphrey Smyth: Procurement SIC: Construction Size: 20+ employees Recency: 5 (moderate) Frequency: 2 (light) Volume: 8 (high) Needs: B1 (Price Sensitive) S2 (Volume Discounts) S5 (Generic Products) Bu9 (Payment Options) Sample Customer Records
Test Methodology Test methodology Campaign selection criteria: Multiple campaigns Legacy campaigns Channel selection criteria: Legacy Prevalent Test basis: Conventional database marketing (control) Integrated database marketing (test) Success measures: Response rates Revenue/account Cost/account
Campaign Test Campaign A. Direct Mail promotion offering discounts on discontinued items B. Direct response campaign using vertical line catalog and no discounts Acquire Cross-sell C. Direct response vertical product promotion with discount Grow value Acquire Upsell
Results Results Response RateRevenue YieldCost Campaigns Control Test Change Control Test Change Control Test Change A .05% .85 +1600% $110/Acct $210/Acct +91% $61/Acct $43/Acct -29% B Acquire6.5% 9.9 +52% $6/Acct $10/Acct +67% $3.30/Acct $2.50/Acct -24% Gross-sell 4.3% 5.1 +19% $3.50/Acct $5/Acct +43% $1.90/Acct $1.35/Acct -29% C Grow valueNA NA NA $26.60/Acct $31.10/Acct +17% $14.63/Acct $10.83/Acct -26% Acquire NA NA NA $13.60/Acct $15/Acct +10% $7.48/Acct $5.39/Acct -28% Upsell NA NA NA $3.18/Acct $4.38/Acct +38% $1.75/Acct $1.28/Acct -27%
Implications Implications Small business market management expects integrated database marketing to add $100 million/yr in revenue and… About $200 million in margin
Case Study #2: company Profile Company Profile Type of Business: Telecommunications service provider Size: $30 billion/year, 1-2 million business customers Geographic Scope: U.S. Channels Used: Direct sales Direct mail Call centers Internet Walk-in centers Customer Base: Large to small businesses Database Resources: • Data warehouse • Customer records include purchase, usage history, SIC, number of employees, number of locations Primary Targeting Method (prior to 1996) • Market manager judgment • Historical campaign performance • Underpenetration models
Marketing Problem Marketing Problem Business revenue growth flat at 5%/yr Response rates and revenue yields on most marketing initiatives flat or declining Competitors taking increasing share in formerly monopoly market Objective: improve campaign response and revenue rates
Remedial Actions Remedial Action Conduct research to identify needs and emerging business problems Business needs Communications needs Product category needs (voice, data, and Internet) Business communications problems Segment customers on needs and problems Assign all business customers to segments Integrate needs and problems into marketing database Proposed application: Use needs, purchase propensities and historic behavior to systematically identify opportunity and prioritize targets Use needs and problems in targeted MARCOM collateral Test methodology, refine process and rollout
Campaigns Test Campaigns A. Telephone prequalification, direct sales campaign to winback customers who switched to competition in top sales region B. Telephone prequalification, direct sales campaign to sell “data solutions” -- a mix of data services to solve customer problems C. Call center campaign to sell additional telephone line(s) to one line customers
Remedial Actions Test Methodology Campaign selection criteria: Multiple campaigns Attack existing threats/problems Channel selection criteria: Use direct sales Use call center Test basis: Conventional database marketing approach (control) Integrated database marketing (test) Success measures: Lead rates Cost rates Sales rates
Sales Rate Close Rate Revenue/Sale (Sales/Contact) (Sales/Lead) Campaigns Control Test Change Control Test Change Control Test Change A3.8% 5.4% +42% 26% 41% +58% $222 $497 +124% Hot Lead Rate Cost/Lead Revenue/Sale (Leads/Contact) Campaigns Control Test Change Control Test Change Control Test B 2.1% 4.2% +100% $71 $44 -38% NA NA Number of Revenue Lines Sold Campaigns Control Test Change Control Test Change C 1,705 2,015 18% $341,000 $403,000 18% Results Results
Implications Integrated database targeting methods produce significant improvements in: Sales rates Close rates Lead rates Revenue Costs
Summary Key Points Database targeting methods that incorporate needs into target selection models produce significantly better results than conventional techniques that rely on customer and secondary data only Needs can be identified for individual customers with sufficient reliability to produce demonstrable impacts Pilot studies are key to proving value: investment NOT an expense!