Download

1 / 22
230 likes | 383 Views
Diagnosis of Multiple Arbitrary Faults with Mask and Reinforcement Effect. Jing Ye 1,2 , Yu Hu 1 , and Xiaowei Li 1 1 Key Laboratory of Computer System and Architecture Institute of Computing Technology Chinese Academy of Sciences 2 Graduate University of Chinese Academy of Sciences.

E N D
Diagnosis of Multiple Arbitrary Faults with Mask and Reinforcement Effect Jing Ye1,2, Yu Hu1, and Xiaowei Li1 1Key Laboratory of Computer System and ArchitectureInstitute of Computing Technology Chinese Academy of Sciences 2Graduate University of Chinese Academy of Sciences
Motivation • Multiple arbitrary faults occur in the circuit • Single stuck-at fault model is inadequate for diagnosis Distribution of multiplet sizes Source: [L. M. Huisman IEEE TCAD’04]
Outline • Introduction • Multiple-fault mask and reinforcement effect • Prior work • Proposed diagnosis methodology • Overview • Fault tuple equivalence tree construction • Fault tuple equivalence tree scoring • Candidate location choosing and ranking • Fault tuple equivalence tree pruning • Experimental results
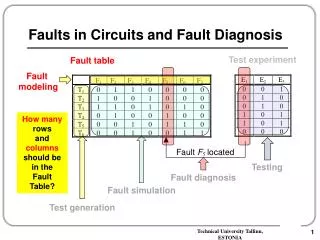
Multiple-fault mask and reinforcement effect • Multiple-fault mask effect • If the fault effect can be propagatedto at least one observation point in the single-fault situation, but be blocked in the multiple-fault situation, then the multiple-fault mask effect occurs. • Multiple-fault reinforcement effect • If the fault effect can not be propagated to an observation point in the single-fault situation, but can be observed in the multiple-fault situation, then the multiple-fault reinforcement effect occurs. Reinforcement /1 /1 /0 Mask
Prior work • Matching the response of the single suspect fault with the response of the circuit-under-diagnosis • [S. Venkataraman, S. B. Drummonds ITC00] • [Shi-Yu Huang VTS01] • Fault simulation with three-valued logic (0, 1, X) • [J. B. Liu, A. Veneris IEEE TCAD05] • Using Single Location at A Time (SLAT) patterns • [T. Bartenstein, et al. ITC01] • [D.B. Lavo, et al. ITC02] • [Zhiyuan Wang, et al. IEEE TCAD06] • Analyzing fault propagation possibility • [Xiaochun Yu, R. D. Blanton ITC08]
Proposed diagnosis methodology overview • Fault-Tuple • A fault-tuple is a set consisting of at least one fault. • Fault-Tuple Equivalence Tree(FTET) • A failing pattern’s FTET describes the relationship among the suspect faults. • First Fault-Tuple • A failing pattern’s first fault-tuple is defined as the fault-tuple consisting of all faults at the failing observation points.
Fault-tuple equivalence tree construction • The line under trace is a gate output. • The line under trace is a stem’s fanout branch. • All the stem’s fanout branches • can be traced. • Part of the stem’s fanout branches • can be traced. First fault-tuple
Fault-tuple equivalence tree construction • The line under trace is a gate output. • The line under trace is a stem’s fanout branch. • All the stem’s fanout branches • can be traced. • Part of the stem’s fanout branches • can be traced. First fault-tuple
Fault-tuple equivalence tree construction • The line under trace is a gate output. • The line under trace is a stem’s fanout branch. • All the stem’s fanout branches • can be traced. • Part of the stem’s fanout branches • can be traced. First fault-tuple
Fault-tuple equivalence tree construction • The line under trace is a gate output. • The line under trace is a stem’s fanout branch. • All the stem’s fanout branches • can be traced. • Part of the stem’s fanout branches • can be traced. First fault-tuple
Fault-tuple equivalence tree construction • The line under trace is a gate output. • The line under trace is a stem’s fanout branch. • All the stem’s fanout branches • can be traced. • Part of the stem’s fanout branches • can be traced. First fault-tuple
Fault-tuple equivalence tree scoring • The highest score : 1 • The faults in a fault-tuple equallyshare the score of the fault-tuple. • Two equivalent fault-tuples get • thesame score.
Candidate location choosing and ranking • Having the highest score • Appearing the most times • The candidate locations chosen at earlier iterations have higher ranks
Fault-tuple equivalence tree pruning • When a fault is pruned, its equivalent fault-tuple will be pruned. • Only when all the faults in a fault-tuple is pruned, the fault-tuple can be pruned.
Experimental setup • Benchmarks • ISCAS’89 • ITC’99 • Test patterns • Nearly 100% single stuck-at fault coverage • 5-detect • Injected fault types • Stuck-at faults • Dominant bridging nonfeedback faults • Transition faults Arbitrary faults
Evaluation Metrics The number of identified actual fault locations The number of identified actual fault locations • Diagnosability = 100%, Top-ranked candidate location is an actual fault location The number of final candidate fault locations The number of actual fault locations • First-hit 0, Top-ranked candidate location isn’t an actual fault location • Resolution = • Run time
Diagnosability, Resolution, Run time and First-hit Diag.:Diagnosability Res.:Resolution R.T.: Run time F.H.:First-hit
Comparison 21 faults (average) 93%vs 66% 21 faults (average) 0.78vs 0.56 * [Xiaochun Yu, R. D. Blanton ITC08]
Diagnosis quality and test patterns The relation between deterministically generated patterns and randomly generated patterns The relation between N-detect patterns and diagnosability The larger N is, the higher diagnosability is achieved. The diagnosis method is independent of ATPG method.
Conclusion Multiple-fault mask and reinforcement effect is a major issue. • Built fault-tuple equivalence trees to consider the mask and reinforcement effect. • Evaluate the capability of each suspect fault to explain the failing patterns. • The proposed diagnosis methodology is effective when confronting a large number of faults. • The proposed diagnosis methodology is independent of fault models, and it can also be applied to any kinds of test patterns.
Thank You for Your Attention • Question?