Download
1 / 24
240 likes | 378 Views
WATER AND ENERGY IN CALIFORNIA The Water Agency Story. Presentation to PANC by Lon W. House, Ph.D. 530.676.8956 lonwhouse@waterandenergyconsulting.com July 14, 2009 San Francisco. Water Energy.

E N D
WATER AND ENERGY IN CALIFORNIAThe Water Agency Story Presentation to PANC by Lon W. House, Ph.D. 530.676.8956 lonwhouse@waterandenergyconsulting.com July 14, 2009 San Francisco
Water Energy • There is exactly the same amount of water on earth as there has always been. We are drinking the same water the dinosaurs drank. • We use energy to: • access water • groundwater • treat water • take out minerals / chemicals / contaminants • store water • move water to where we want to use it • treat water for end use • pressurize, add heat / cool or chemicals • collect wastewater • treat wastewater
California Water Transfer Projects -- Federal CVP, San Francisco’s HetchHetchy, Los Angeles Aqueduct Colorado River > 5 MAF/yr. 4.4 MAF/yr. State Water Project 3.0 – 4.2 MAF/yr. Avg. Energy Use/yr.12.2 Billion kWh Avg. Energy Generation/yr.7.6 Billion kWh
Summary • Water agencies are single largest electricity end users in California ~3,200 MW maximum demand • Water agencies already curtail approximately 400 MW of on-peak demand • Water agency solutions to California electricity problems • Additional peak demand curtailment - +250 MW from existing systems, +1,000 MW with more storage, +250 MW with TOU water meters/rates • Water agency generation • 500+ MW of standby generators available • Hydro - 1,631 MW existing, +500 MW new small (250 MW >1 MW, 250 MW < 1 MW) • Biogas - 40 MW, 36 MW new potential • Natural gas engines - existing ~100 MW, 200 MW additional potential • Solar - 28 MW, +1000 MW potential • Wind – 1.5 MW, 5 MW potential • Water agencies potential for increased demand + ~3,575 MW (next 10 years) • Existing conjunctive use in drought/dry years ~350MW • Proposed conjunctive use development/drought ~ +1,350 MW • Desalinization ~250 MW salt water plus 250 MW desalting groundwater = +500 MW • Electrification of ag diesel pumps = +350 MW • Increased treatment requirements = +160 MW • Increased water marketing - +230 MW • Increased recycled water use - +685 MW
Water Agency Demand Characteristics • ~3,200 MW maximum demand currently • ~2,800 MW summer on-peak demand • water agencies currently shift approximately 400 MW out of the summer on peak period, primarily due to TOU rates (using storage and natural gas engines) • Minimum load ~900 MW • Annual load factor ~0.62 • Seasonal - summer maximum demand is 33 percent higher than winter max; summer energy use is ~60 percent of annual use
New Water Electricity Requirements • Conjunctive Use - 350 MW existing – 1350 MW new • Desalinization - 500 MW (250 desalting + 250 MW ocean desal) • Drought/Climate Change • Increased Treatment Requirements - 160 MW • Increased Water Marketing - 230 MW • Electrification of Ag Diesel Pumps - 350 MW • Increased Conservation – recycled water, agricultural conservation - 685 MW
California Seawater Desalination Projects (18) 10 Northern California 8 Southern California 2008 – 2015 - ¼ to 50 MGD Capacity 975,000 to 1,247,000m3/day 260 -- 330 MGD 0.28 -- 0.36 MAF/yr $2.75/k gal – $5.12/k gal ~4700kWh/acre-ft
Potential Southern California Sites21 million acre-feet dry year storage
Estimated Electricity Generation Potential from WWTP Digester Gas in California Biogas Available from WWTP(Containing 60% CH4) Gross16 Billion ft3/yr Technically Useable11 Billion ft3/yr 23 Existing WWT Plants to Electricity ~ 40 MW (Range 50 kW -- 15 MW; 18 sites < 2 MW; 5 sites > 2 MW) WWT Plants w/o Energy Recovery Operations 222 plants 37 MW Potential 2 plants > 1 MW 50 plants from 200 kW - 1 MW 170 plants < 200 kW
Wind/Solar • Solar -Water agencies single largest sector for solar installations in California - 18 MW operating, 48 MW under construction/consideration, 500+ MW being investigated. • Wind – 1.5 MW operating, up to 5 MW under consideration.
EfficiencyImprovements in Water Implementation Areas • Energy efficiency in water system • Recycled water use • Reduction of peak electrical demand in water system • Elimination of waste - primarily a customer area • Understanding of timing and quantity of use through smart metering • Utility de-coupling of water sales and total income to encourage conservation
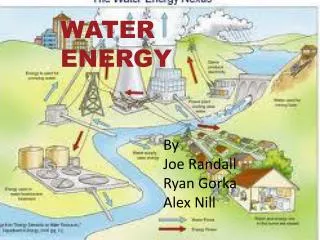
Principle Elements in Water Systems (all require energy inputs) • Primary water extraction, conveyance, storage (in some cases) and supply delivery • Treatment and distribution • Customer on-site water pumping, treatment (chemicals), and thermal inputs (heating and cooling) • Wastewater collection and treatment 7% of California electricity use 12% of California electricity use
California Recycled Water • Water recycling = big savings. Reusing available water results in less fresh water being extracted, and reusing that water results in significant energy reductions compared to using more fresh water. • 166 towns and cities in California now use recycled water • California has a policy that no fresh water can be used for electricity production if there are feasible alternatives
Water Treatment There can be significant-and permanent -energy savings by employing more efficient treatment
EID El Dorado Hills Raw Water and Treatment Plant - July 15-21, 2006
Why Water Savings Programs Are Better Than Energy Savings • Less overhead • Energy projects are typically run by the electric utilities. Water efficiency programs typically deliver much more of the dollars spent in the actual on-the-ground projects. • Water efficiency savings more permanent • Energy efficiency tends to be much more transitory, due to the substitution (Snackwell) effect. As population in California doubled during the last 30 years, electricity use has doubled, whereas water use has stayed the same. • Water efficiency saves both water and energy, energy efficiency savings save only energy • Between 3-5% of all the electricity used in the U.S. is used to treat and distribute water (in California the number is over 7%). That means every time you save water you also are saving the energy that was previously used to treat and distribute that water. • When you save energy (with a more efficient refrigerator) you only save energy, no water. Water savings gives you double bang for your buck.
California Water-Energy Pilot Program The CPUC pilot allows the investor owned energy utilities (IOUs) to partner with a water provider to implement a jointly funded program designed to maximize embedded energy savings per dollar of program cost. This pilot focuses on efforts that would: • Conserve water • Use less energy-intensive water • Make delivery and treatment systems more efficient • Determine actual water savings and actual energy savings The goal is to develop electric / gas utility programs that save water as a means to saving energy. The Programs • Multifamily High Efficiency Toilets • Single Family High Efficiency Toilets • pH and ET Controllers - commercial/industrial facilities • Leak Detection Water Systems • Large Customer - Ozonation • Emerging Technology - water system SCADA systems • Recycled Water • Managed Landscape - ET controllers • Natural Gas Pump Efficiency • SDG&E Large Customer Audits
Conclusions • Water agencies major energy users • Contribute over 400 MW to on-peak demand reduction • Could increase to almost 1000 MW • Water agencies poised to significantly increase electrical demand • New water sources are more energy intensive than existing • lower quality water, further distances • New treatment uses more energy • Water agencies can meet a significant portion of their electrical demand with renewable generation • Improving water systems energy efficiency has significant and long lasting impact.
Recommended Policies • Encourage water customers to increase their water efficiency • Encourage water systems to invest in more efficient components • Allow water systems to generate more of their own power • biogas, solar, wind, small hydro