Download
1 / 207
2.08k likes | 2.21k Views
Centre for Demography. Improving Migration and Population Statistics . Improvements to Population Statistics Richard Pereira Head of Migration Research. Domestics. Fire Exits Fire Alarm Refreshments Lunch at about 12:30 Tea and Coffee about 2:30 Close at about 4:00 Toilets

E N D
Centre for Demography Improving Migration and Population Statistics Improvements to Population Statistics Richard Pereira Head of Migration Research
Domestics • Fire Exits • Fire Alarm • Refreshments • Lunch at about 12:30 • Tea and Coffee about 2:30 • Close at about 4:00 • Toilets • ONS Facilitators • Delegate Packs • Questions
Why we are here • Importance of migration: • Key component of population change • Changing society • Economic situation • Drivers for improvement work: • relevant statistics • multiple purposes and customers • timeliness, quality
Programme Vision Migration and Population Statistics meeting user needs: • At the right time • Covering the relevant populations • Measuring change accurately (national and local) • Detecting turning points And are trusted as authoritative: • Based on range of developed best up to date sources • Enhanced, transparent, sustainable, statistical methods • With quality measures By highly engaged users
Aims of the day • To gain an understanding of the proposed package of improvements for the 2008 round • To see how these fit into the longer term strategy • A chance to influence the improvements • Spot any issues with the improvements • Identify if we have missed anything • Identify where further supporting material may be needed • Provide expert local insight
Agenda 11:00 Morning session • Introduction • Package of Improvements and Timetable • Views from LGA • Adjusting internal migration using data on students 12:30 Lunch 1:00 Afternoon session • International migration – modelling the geographical distribution of long-term migrants • Short-term migrants at local authority level 2:30 Tea Break • Other improvements • Question panel 4:00 Close
Centre for Demography Improving Migration and Population Statistics Background and Context Jonathan Swan Head of Change Management, ONSCD
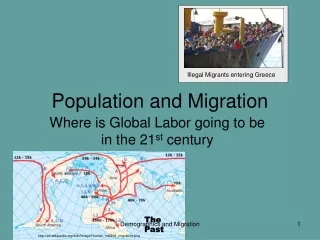
Context • New and emerging sources • These provide a valuable opportunity to increase the quality of population statistics • Here today to inform you about how we will intend to use these sources • And to get feedback on these proposals • And we are using this opportunity because • Migration is important - a key part of population change • It is difficult to measure • So important we capitalise on admin sources
Communities & Local Government’s interest in Population & Migration Statistics • CLG and Migration: • Migration issues for CLG - impacts on local areas and communities; incl. development of evidence and improving statistics • Managing the impacts of migration - support for local service providers in managing change.
Communities & Local Government’s interest in Population & Migration Statistics • Use of population and migration statistics: • Research and analysis of migration trends, patterns and impacts - use of migration estimates and local indicators • Local government finance settlement - formula grant distribution use of population data • Household projections - demographics main driver of household growth
Use of Population Data in Formula Grant Distribution System • Data used in formula grant distribution has to be the best data available on a consistent basis for all local authorities and available at the time. • ONS sub-national population projections • Used because resident population is key client group for most services • Used projections for 2008, 2009 & 2010 from the revised 2004-based projections for current 3-year settlement (2008-09 to 2010-11) • Next multi-year settlement will be calculated in 2010 • Expect to use 2008-based projections as the latest data available • Mid-year population estimates • Mainly used to express indicators as proportions of the population • Used mid-2006 estimates in current 3 year settlement • Expect to use mid-2009 estimates in next multi-year settlement in 2010
Welsh Assembly Government interest in Population & Migration Statistics • Demographic change has implications for the planning and provision of wide range of public services in Wales eg education, health, planning • Use of population and migration statistics: • Analysis of demographic and population trends for Wales • Key data Set in Revenue Settlement Grant • Used for population and household projections
Use of Population Data in the Revenue Settlement Grant (Wales) • Data used in the Revenue Settlement Grant has to be the best data available on a consistent basis for all local authorities and available at the time. • Mid-year population estimates • Mainly used as indicators within the Settlement for key age groups; • Used to calculate the indicator weights (within regression model); • Used mid-2008 estimates in the latest settlement (2009-10) • Expect to use mid-2009 estimates in next settlement (2010-11) • Sub-national population projections • Good for WAG medium term planning. Used internally for indicative settlements, but not for allocations. • Proposed for use in the Settlement (for multi-year settlements), however further discussion and analysis of accuracy and suitability of projections required before any decisions are taken. • Multi-year settlements using these are the long-term plan for the WAG;
The Population StatisticsImprovement Strategy Short Term • Use aggregate administrative data to improve data on geographical distribution of migration • Provide additional sources of information on migration • Provide information in a more accessible way • Obtaining data through legal gateways
The Population StatisticsImprovement Strategy Medium Term • More extensive use of admin sources • Using record linking techniques, to supplement current sources of migration data • Quantitative measures of quality • Improved timeliness • 2011 Census Long Term • ‘Beyond 2011’ strategy • Address lists? • E-Borders
The PackageImprovements in the 2008 round • Distribution of international migration using administrative data • Student adjustments using HESA data
Improvements that change population estimates or projections. • Distribution of international migration using administrative data • Student adjustments using HESA data • Port survey improvements • Other refinements to existing methods
Reporting • Migration web page • Annual Migration Report • Comprehensive overview of UK migration during 2008. • Migration Statistics Quarterly Reports • Regular updates on research progress • Coherent across government • Information from ONS, DWP, and the Home Office A more coherent message interpreting the statistics
Communications and Engagement Strategy • A formal quality assurance strategy • Interactive engagement at an early stage • Reference Panels • ONS/LGA Workshops • Early round of Seminars • Regular Updates on the web • Chance to comment on results • Local Insight Reference Panels • Formal Academic Peer Review • Formal Consultation • Additional round of Seminars with indicative impacts A collaborative approach to involvement, to help improve the quality of the statistics
The timetable • First Rollout of Migration Indicators 20 May 2009 • Reference Panels - ongoing • LGA Workshops - ongoing • Seminars June 2009 • Mid-2008 mid-year population estimates for LAs – 27 August 2009 • Short-term migration estimates at LA level - 27 August 2009 • National Population Projections – 21 October 2009 • Consultation Dec 2009 to Feb 2010 • Consultation on improvements in parallel with English SNPP assumptions • Additional seminars during consultation • Indicative impacts published at start of consultation • Publish subnational projections for England (ONS) and Wales (WAG) – 27 May 2010 • Publish revised 2002 to 2008 estimates – 27 May 2010 • Mid-2009 population estimates - August 2010
The Consultation • Part of engagement and quality assurance • December 2009 to February 2010 (approx) • Consulting in parallel on: • Assumptions for Subnational Population Projections • The improvements to population and migration statistics • Will be supported by a major package of documentation: • Indicative numerical impacts of the improvements at LA level • Detailed methodological documentation • Reports from the reference panels and academic peer reviews
The Consultation • Looking for comments that will help us improve the package • Comments likely to: • Lead to refinements of methodology and its implementation • Help shape future research
December Seminar Roadshows • Supporting the formal consultation • Will be focussed on the numerical results • Will provide an opportunity to discuss and feedback on the impacts • Dates and venues to be arranged • But will be in at least 4 locations across England and Wales • Most likely around 30 November to 11 December
Local Government Perspective ONS seminars on Improvements to Population Statistics Nick Holmes, Head of Data Development and Support
Interest in people • Same but different • Issues
Interest in people • Funding • Funding formula • Population related • Specific grants • Total population • Sub-populations • Service delivery • Service planning • Policy / strategy • Monitoring
Interest in people • Monitoring change • Population level • Sub-groups • Monitoring effectiveness • Policy • Strategy • Performance
Same but different • Devolution • Treasury vs Barnett • 3 year settlements • Divergence of policy
Issues • When do we need the information? • Change and instability • Is that everyone? • BUT • Estimates more reliable • Are finance distribution • systems too rigid?
Questions? Questions guaranteed, answers are not nick.holmes@dataunitwales.gov.uk 029 2090 9500
Improving population statistics – a local government perspective Jill Mortimer Local Government Association Improving Population Statistics - a localgovernment perspective
Outline Why do the figures matter to local government? What are the problems with the figures? What should have improved for the next funding round? Who is still missing? Longer-term improvements Knotty problems
Why do the figures matter? Accurate data underpins good service planning and delivery – for customer insight Accurate denominators for performance indicators – for resource allocation Accurate information for citizens – ‘evidence’ to trump ‘anecdote’ Accurate information for funding settlement – to afford key workers
What are the problems? Long-term migrants missed in IPS Undercount from 2001 census Short-term migrants uncounted in population estimates Inaccurate distribution around the country Internal migration inaccuracies Different sources paint different pictures
What should improve by 2010? Internal migration estimates (of students) Distribution across country (provided this includes regional distribution) Short-term migration figures for local areas
Who is still missing? Those missed at 2001 Census Missed long-term migrants Misallocated internal migrants
Longer-term improvements 2009 improvements to IPS sample 2011 census E-borders New health sector recording system Better student data
Knotty problems Fluctuations in local estimates Two 2008 denominators for performance indicators Imperfections in administrative systems Students leaving college
The 15-minute Rant 26 June 2009 RSS GLADEMOGRAPHY
‘It is a truth universally acknowledged …’ • Jane Austin – Pride and Prejudice GLADEMOGRAPHY
‘… that a country that is one of the world’s top economies should be able to accurately estimate the population of administrative areas and do so in a timely manner.’ • John Hollis– personal prejudice GLADEMOGRAPHY
But that is not an easy task. • Migration, Migration, Migration. • Especially International moves GLADEMOGRAPHY
Why we need good local migration estimates • LA and HA settlements => based on population projections => based on population estimates => based on migration estimates • Good LA estimates => better small area estimates • Estimates underline indicators (IMD, etc) • QA for 2011 Census GLADEMOGRAPHY
Where do we need to start? • Regional Distribution • University of Leeds New Migrant Databank • LA Distribution • Review/do away with NMGi in London – and maybe elsewhere GLADEMOGRAPHY
New Migrant Databank • Leeds University ESRC UPTAP project • Already used HESA/NINo/Flag 4 to break TIM down to regions: • London +20k +12% • West Midlands +11k +33% • North West +4k +8% • East -14k -23% • Yorks and Humber -10k -21% • South West -8k -19% • South East -4k -4% GLADEMOGRAPHY
NMGi in London GLADEMOGRAPHY
How can we tell if estimates are right? • ‘Sense Check’ results • Trends in: • General Fertility Rate • Standardised Mortality Rate • Sex Ratios • Age structure • Households GLADEMOGRAPHY
GFR GLADEMOGRAPHY
Sex Ratios GLADEMOGRAPHY